


The Aggregate Expenditures ModelSection 01: The Aggregate Expenditures ModelNow we will build on your understanding of Consumption and Investment to form what is called the Aggregate Expenditures Model. This model is used as a framework for determining equilibrium output, or GDP, in the economy. When we developed the Consumption Function in a previous lesson, we stated that Consumption was a function of Disposable Income. In this model, we return to the assumption of the Circular Flow Model that the production of the final goods and services in the economy (the GDP) results in a flow of income that is exactly equal to the value of that output. Since the GDP is equal to Income, we can model the Spending (for now just Consumption and Investment) in the economy in terms of GDP instead of in terms of Income.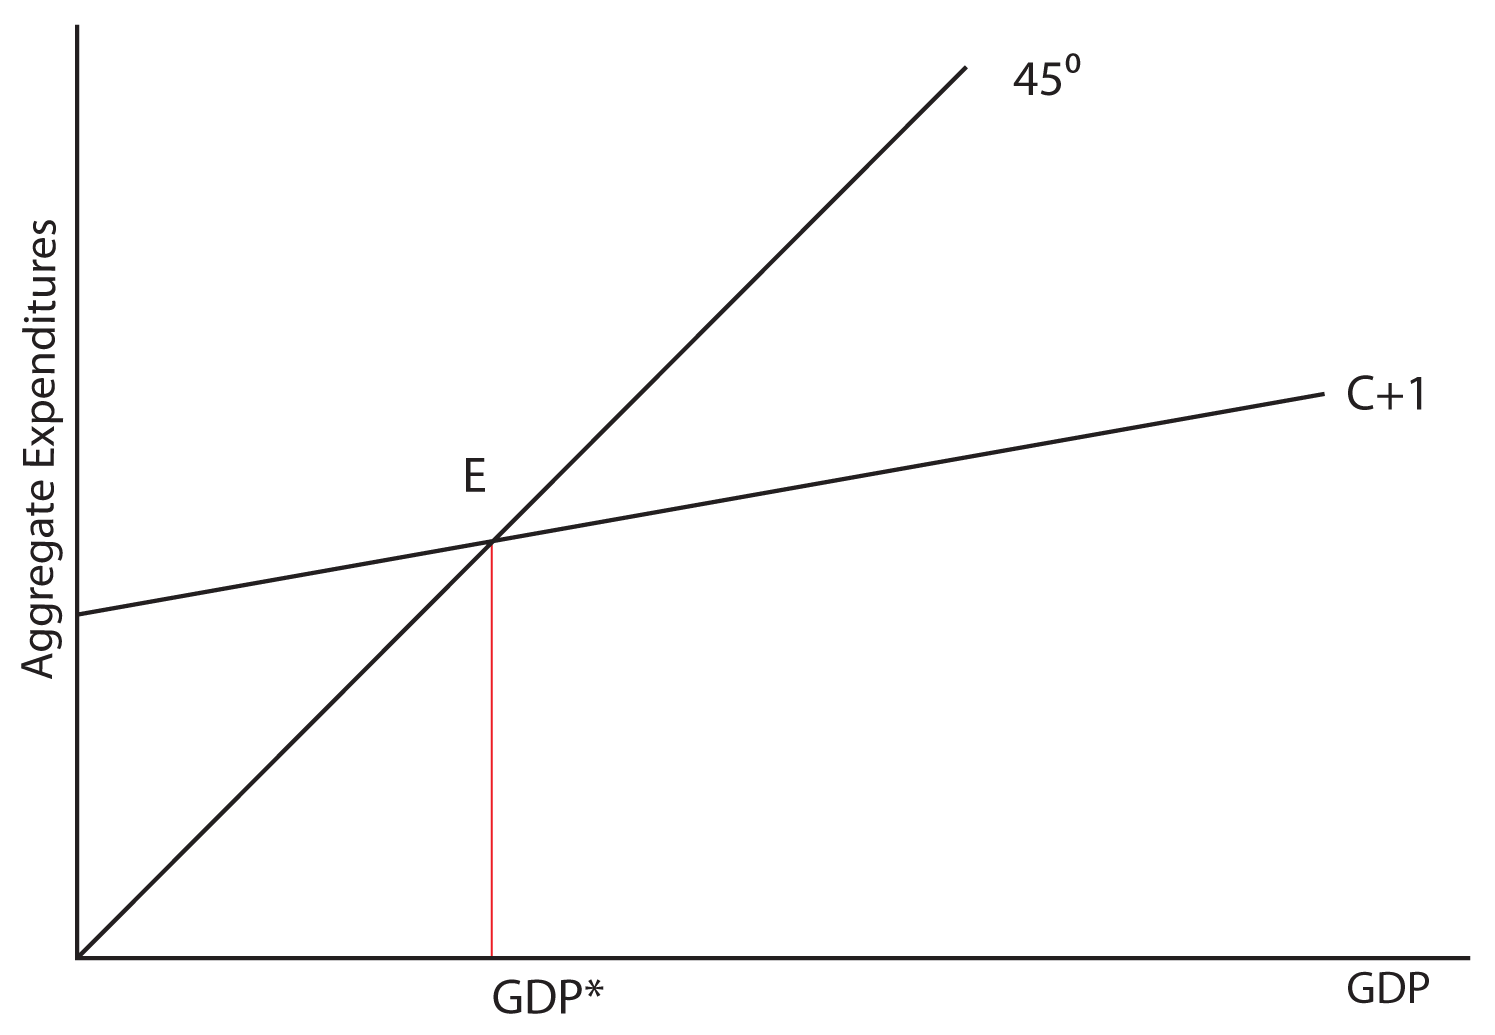 In the above graph, we labeled point E as the equilibrium point and GDP* as the equilibrium level of the GDP. Let’s explore why E is equilibrium. Remember that one of the characteristics of equilibrium is that if you move away from it, natural market forces should automatically move you back toward the equilibrium. Observe this process in the graph below: 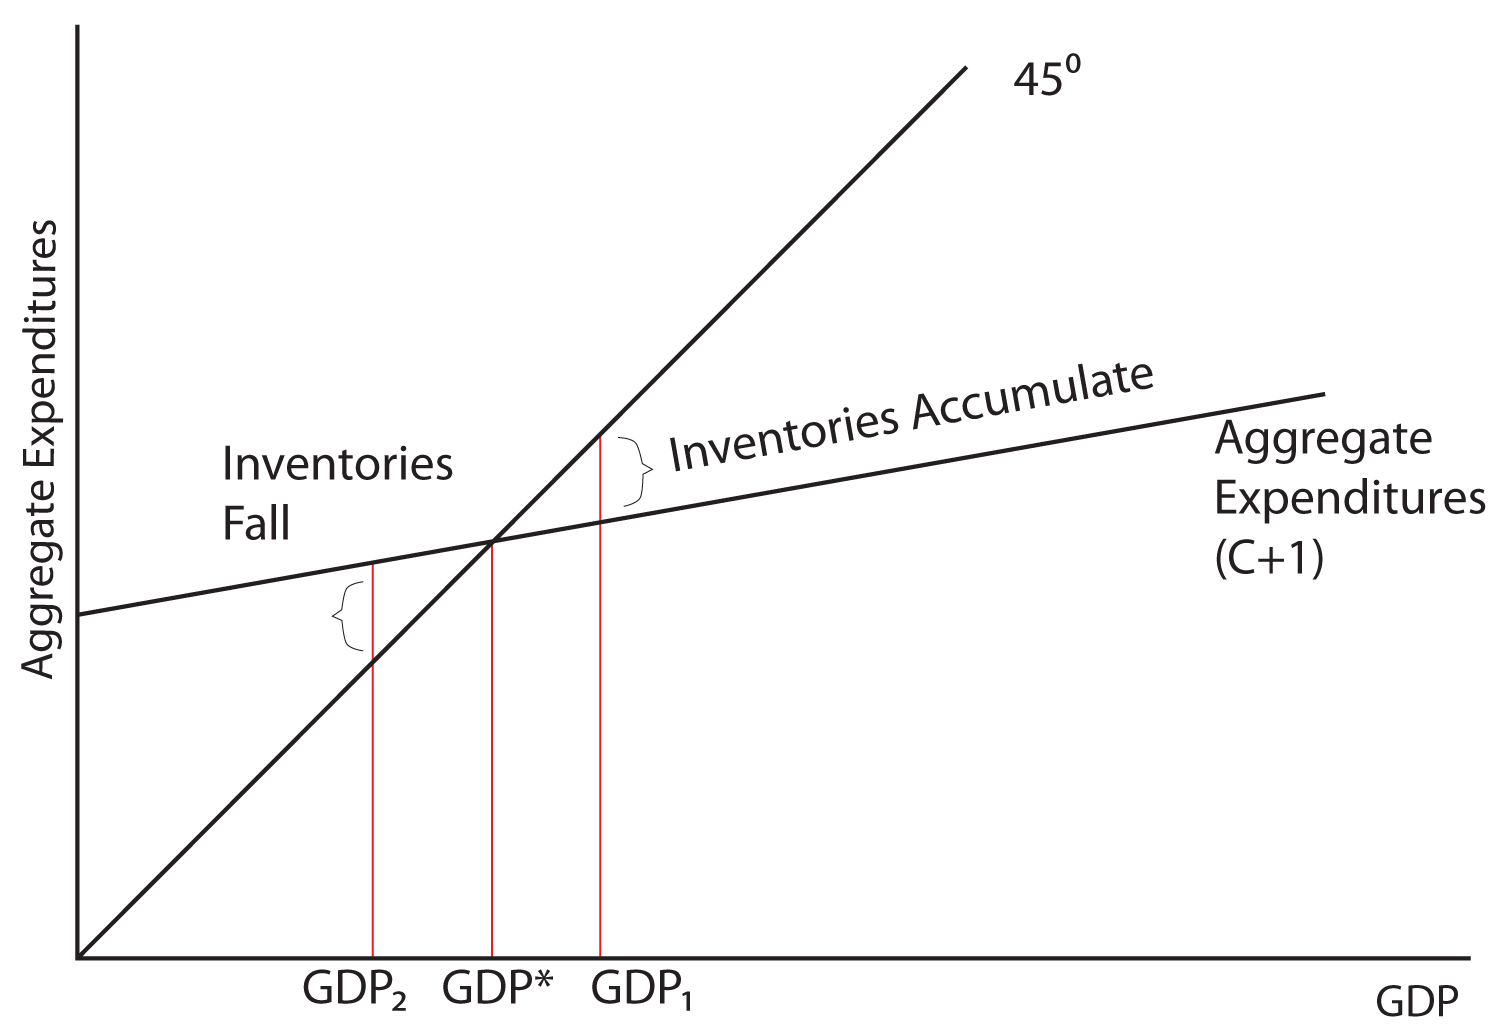 If the economy were for some reason producing at GDP1 instead of GDP*, what would be the result and what market forces might induce the economy to return to GDP*? Notice: at GDP1, total spending is less than output. We know that spending is less than output because at this level of GDP the Aggregate Expenditures line is below the 45 degree line, which is the line where spending is equal to output. So spending would be equal to output at point A, but actual spending as measured by the Aggregate Expenditures line is below that (labeled B). Imagine you are running the economy. Each month, you are producing 10,000 units of output and people are buying 9,000 units of output. Each month, you would be adding 1,000 units of output to your inventories and over the course of the year, inventories would be piling up. Imagine that producers have a certain level of inventories that they desire to have on hand, but that they do not want the stock of inventories to substantially grow or depleted. At GDP1, inventories would be piling up at the rate of 1,000 extra units of inventory each month! What would you do if you were running the economy and unwanted inventories were building up? Wouldn’t that be a signal to you to reduce production? As you reduce production, output or the GDP, falls from GDP1 to GDP*. What if the economy were producing at GDP2? Now the Aggregate Expenditure line is above the 45 degree line, indicating that spending is above output. Spending would be equal to output at point D, but actual spending is at point F. Imagine that the economy is producing 5,000 units of output each month, but that consumers and businesses together are purchasing 6,000 units of output. How would it be possible for more to be bought than what is produced in any given time period? It would be possible if businesses have unsold inventories on hand. But if a business has an ideal level for their inventories that they want to maintain, and purchases exceed production, inventories will be drawn down or depleted. What would naturally happen in an economy if spending were greater than production and inventories were falling? Businesses would begin to produce more, and the output or GDP of the economy would rise from GDP2 to GDP*. To summarize, notice that in this model:
Output = Spending
GDP = Consumption + Investment
Savings and InvestmentA second way of looking at equilibrium is through savings and investment. Remember that when people save, they are withdrawing spending from the flow of income and expenditures. Savings is therefore called a leakage. When businesses invest, they are adding spending to the flow of income and expenditures so that Investment is called an injection.Equilibrium output is achieved when:
Leakages = Injections
or
Savings = Investment
If savings is greater than investment, then GDP is too high and
output will fall. If savings is less than investment, then GDP is too
low and output will rise. Let’s look at this graphically.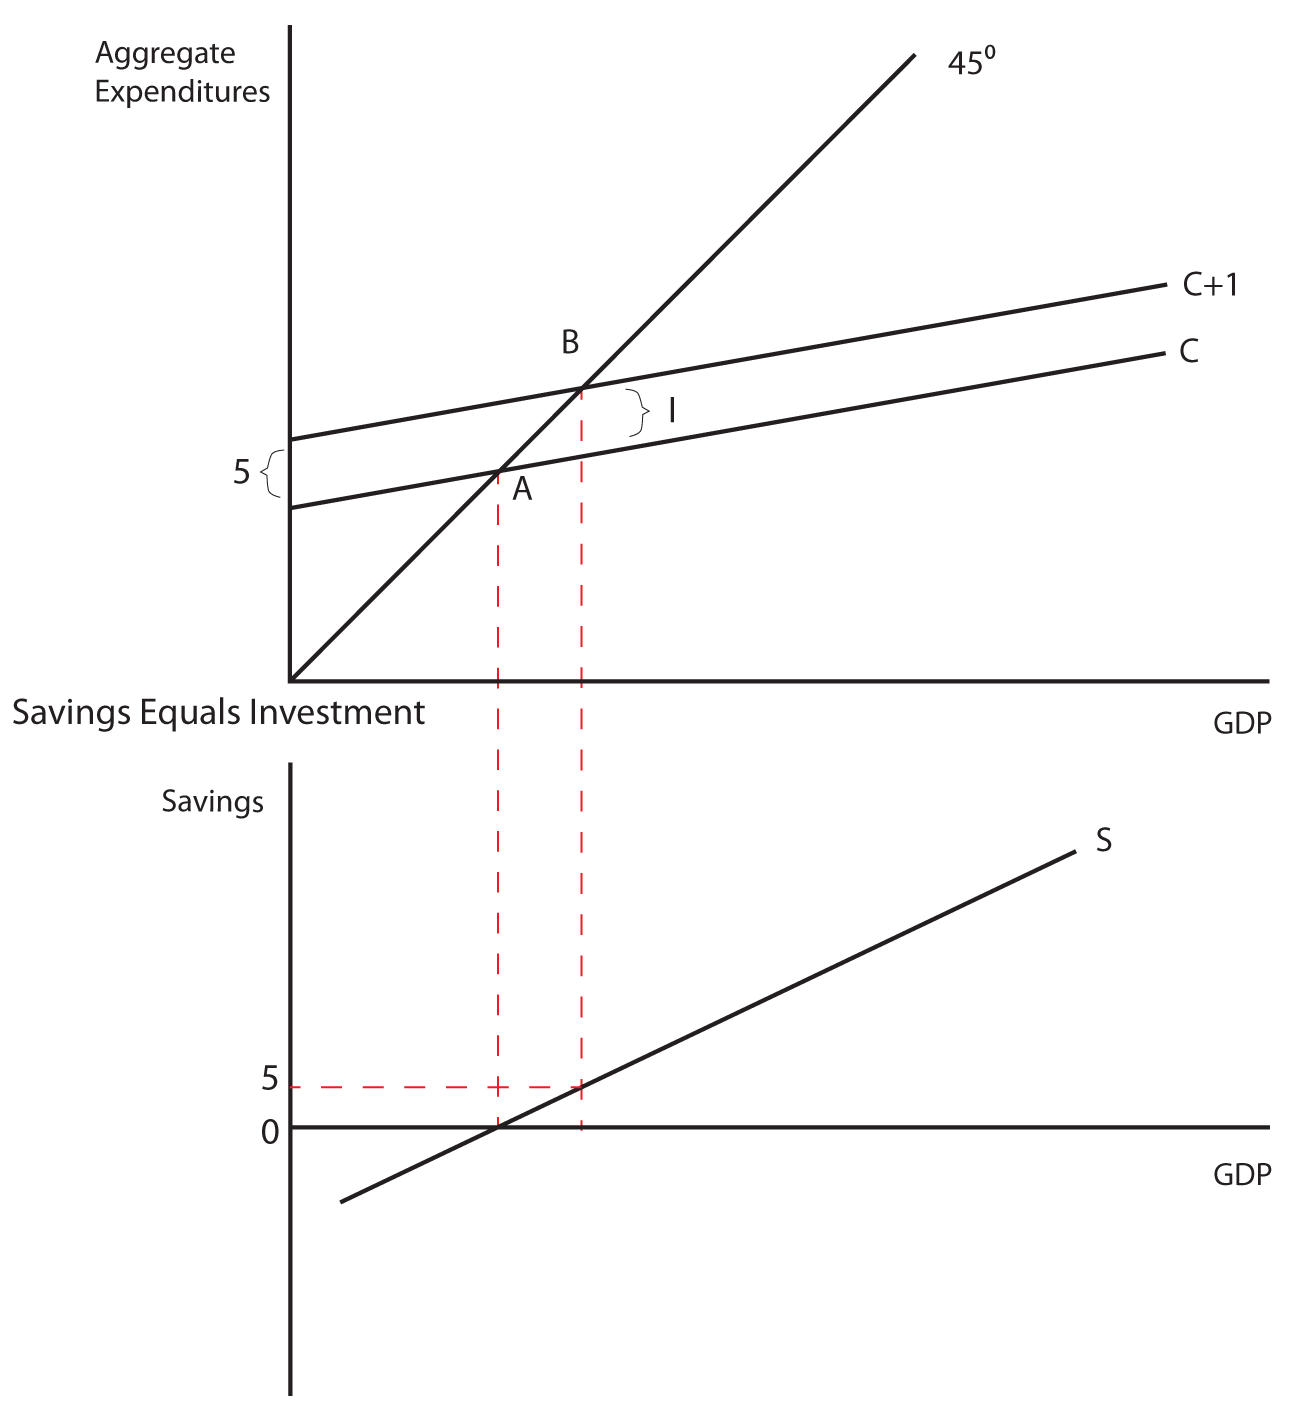
Think About It: Aggregate Expenditures
In the table below is data for a hypothetical private-closed economy. Private means that there is no government and closed means that there is no foreign trade. We will consider a mixed (both a private and a government sector) and open (one that accounts for foreign trade) economy later. Use the information in this table to graph the aggregate expenditures line on one graph and the savings and investment schedules on another graph. Show how these graphs illustrate that the aggregate expenditures of the company are in equilibrium. This means “spending equals output” is the same thing as “savings equals investment.”
The Investment MultiplierThe model of Aggregate Expenditures that we are currently considering is often called a Keynesian Model because it was first formulated by British economist John Maynard Keynes in his General Theory of Employment, Interest, and Money, published in 1936—at the height of the great depression. One of the central premises of Keynesian economics is the idea of a multiplier. Keynes hypothesized that a given increase in spending would cause output to increase by a multiple of the increase in spending. How is this possible?Let’s start with the case of Investment spending. When a business spends $1 on new plant or equipment it injects $1 into the economy. That $1 becomes income to someone (whoever built the machine or constructed the new plant) who spends a portion of it and saves the rest. The portion they spend and the portion they save depends on their MPC and their MPS. The portion that is spent becomes income to someone else who likewise spends a portion, which becomes income to another, who spends a portion, and so on. The spending stream can be characterized in the following way:
$1 + $1(MPC) + $1(MPC)(MPC) + $1(MPC)(MPC)(MPC) + …
Or
$1 + $1(MPC) + $1(MPC)2 + $1(MPC)3 + …
Which can be shown in its limit to equal 1/(1-MPC). This is called the
Investment Multiplier. As long as the MPC is less than 1, the
multiplier will be greater than one. In fact, we can show that
Example Let’s consider a scenario where firms in the economy decide to increase investment spending by five million dollars. If the MPC is equal to .75, the Investment Multiplier is equal to four and output in the economy will go up by 20 million dollars (the five million dollar increase in Investment times the multiplier of four). Graphically this is shown below: 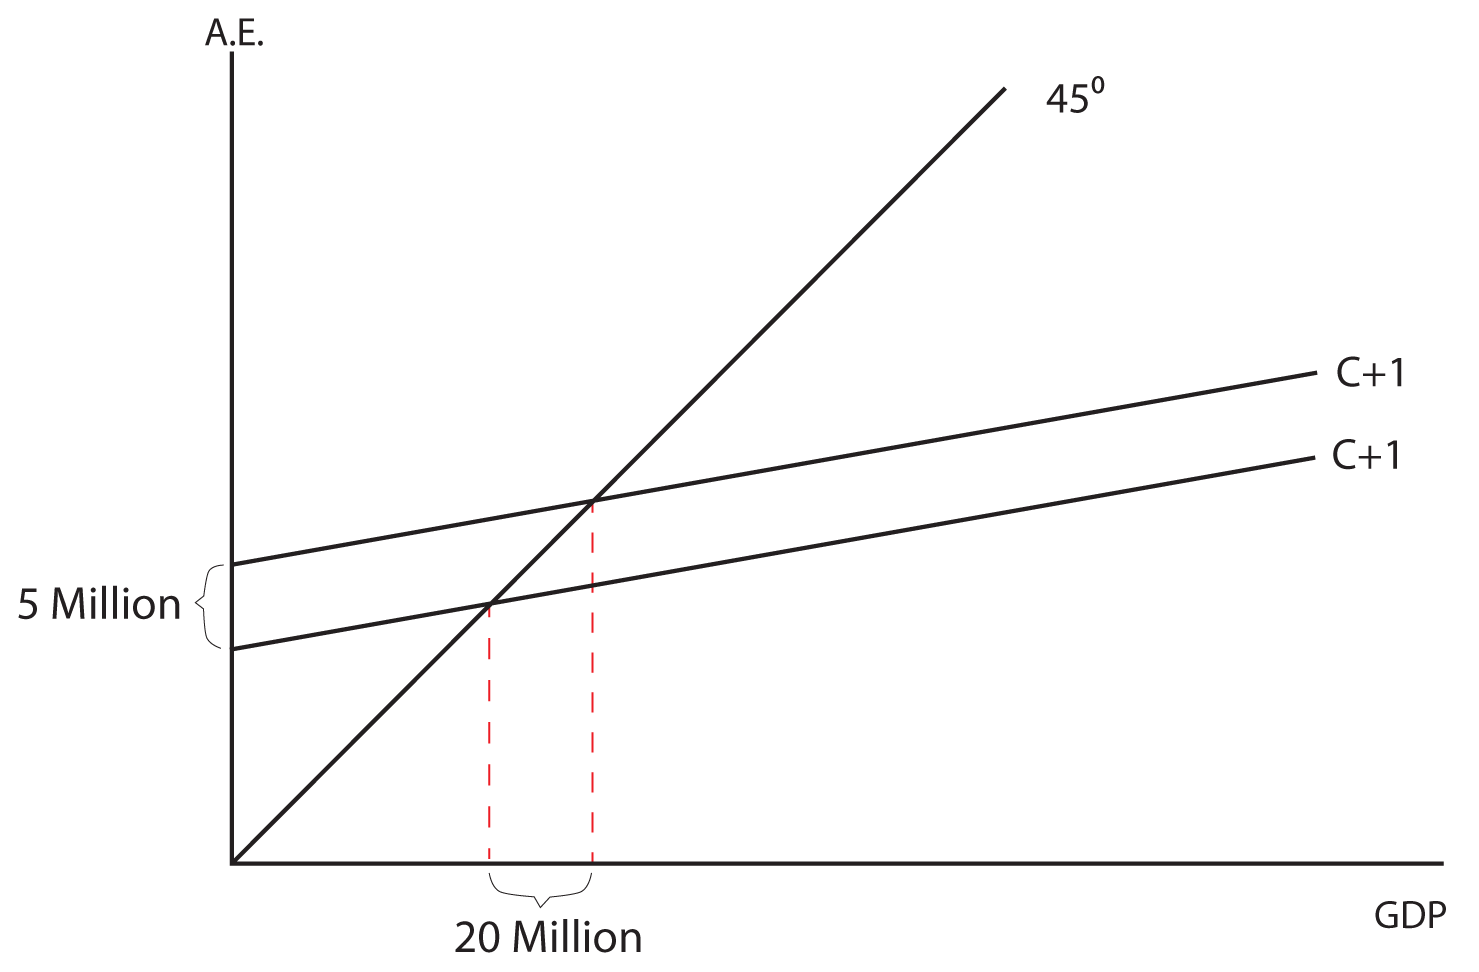
Think About It: Investment Multiplier Calculations
Based on the graphs given, answer the following questions. 1. In the first graph, if the MPC is 0.75, what is the new level of GDP when aggregate expenditures go up by two million? 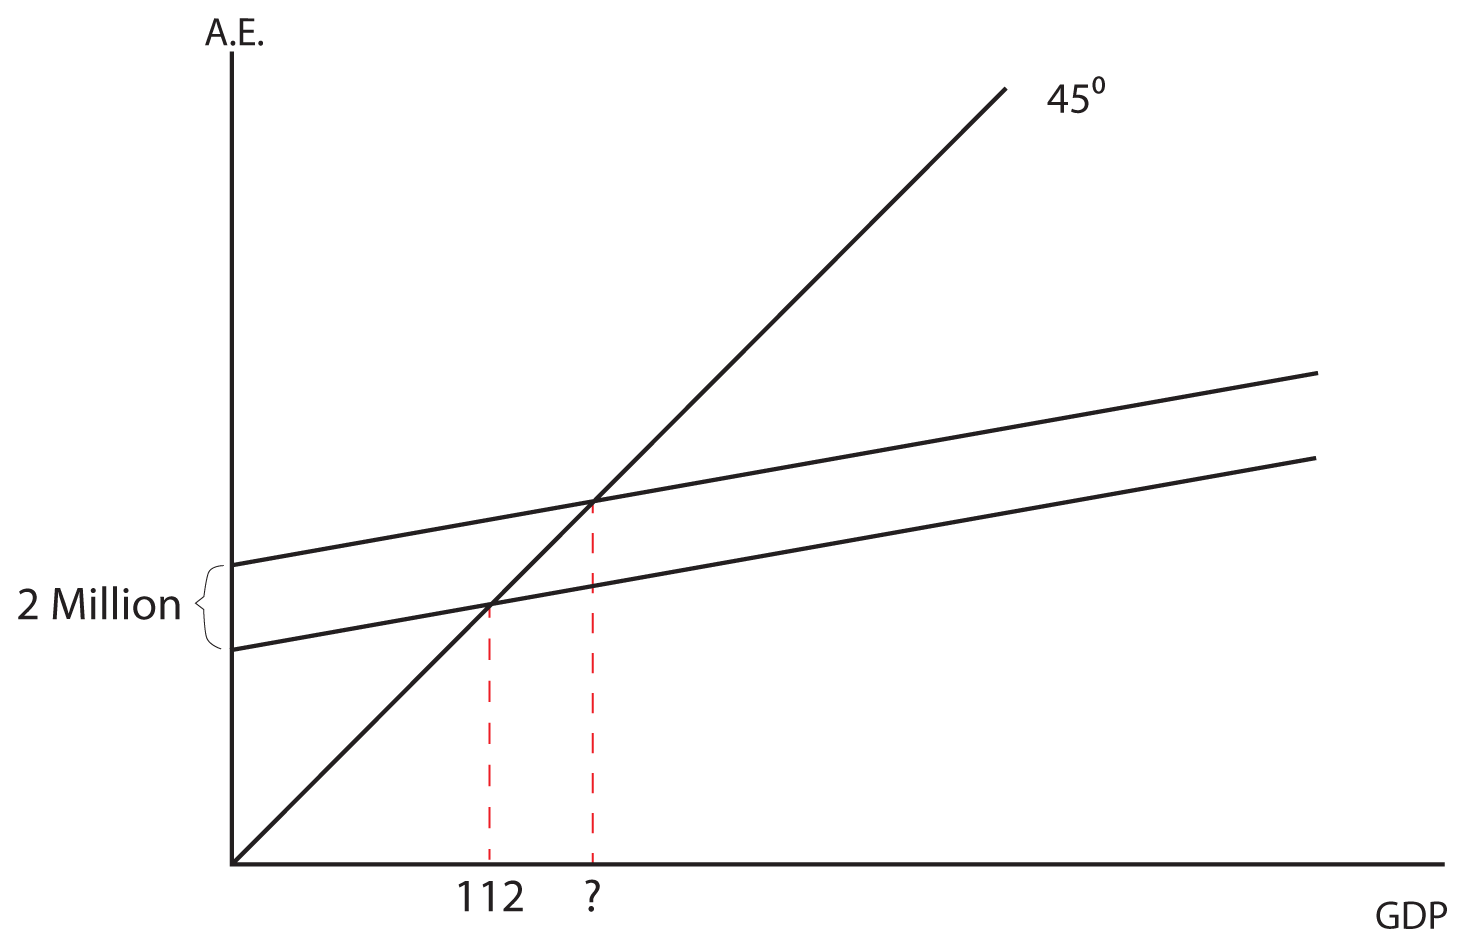 ANSWER 2. In this graph, what is the multiplier and what is the MPS? 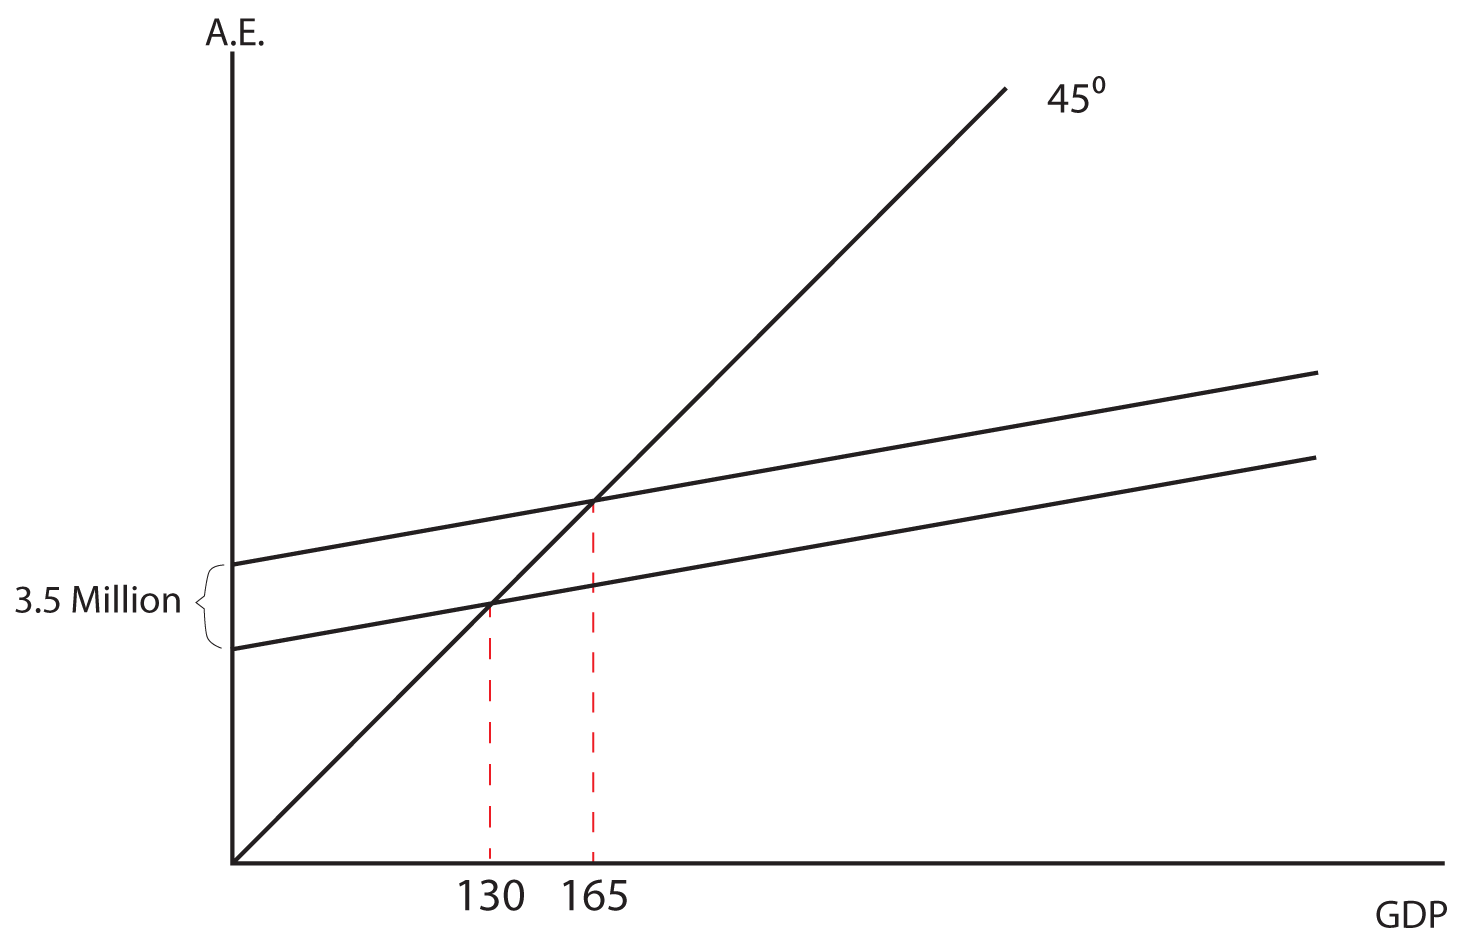 ANSWER 3. In this graph, if the MPS is 0.2, how much did aggregate expenditure go up by to get the indicated increase in GDP? 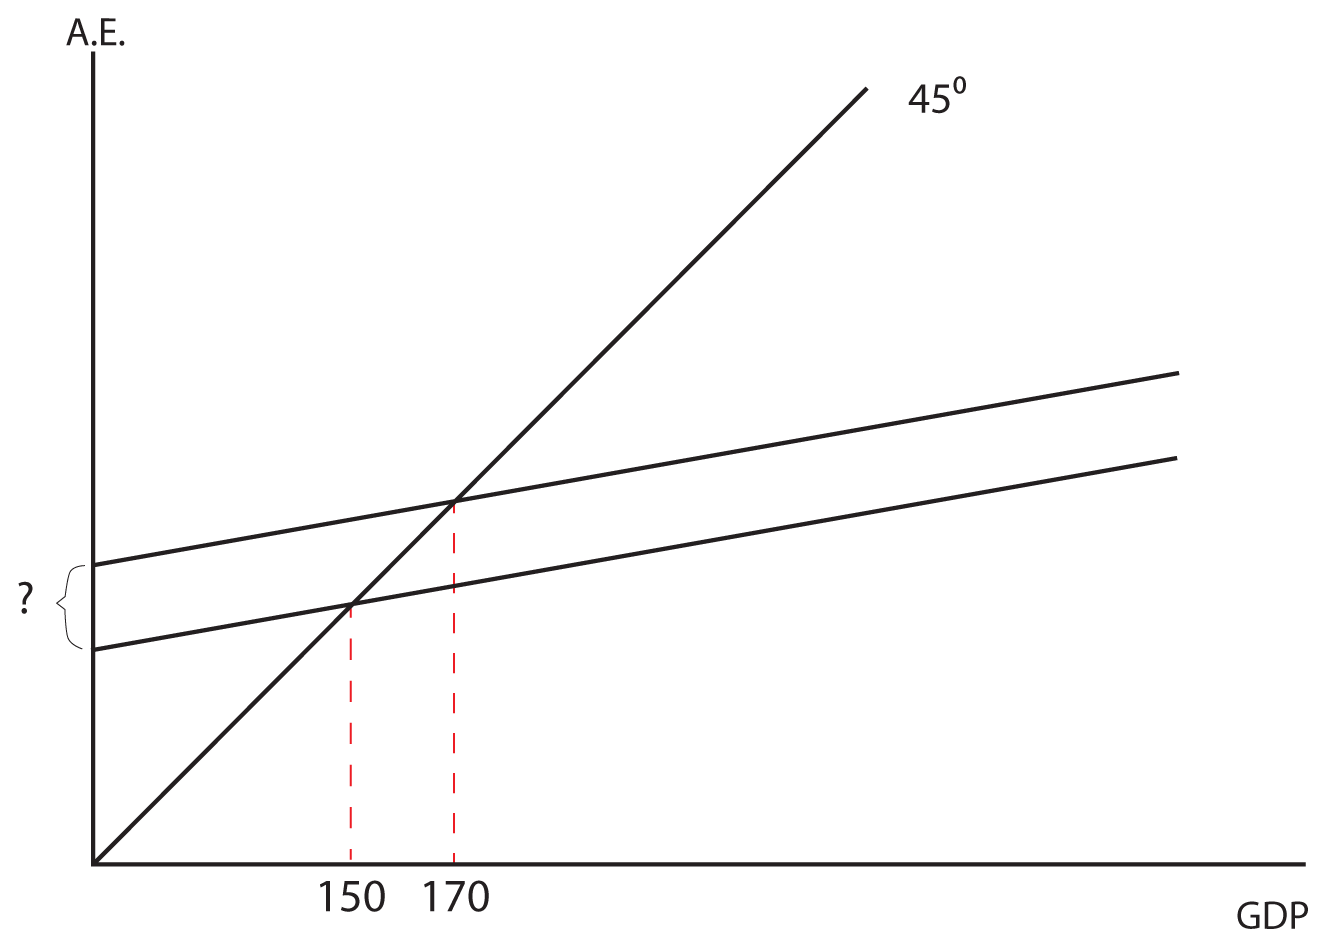 ANSWER Section 02: Government SpendingNow let us consider a mixed (both government and private spending) closed (no net exports) economy. The basic change is that we are now adding government spending to the model. Since government spending is determined by a political process and is not based on the level of the GDP, it is graphed as a horizontal line when GDP is on the horizontal axis. When this horizontal line is added to the upward sloping Aggregate Expenditures line, it simply shifts Aggregate Expenditure upward by the amount of the government spending. See the two graphs below for an illustration. The equilibrium GDP will be determined by where the C+I+G line intersects the 45 degree line in our standard model. 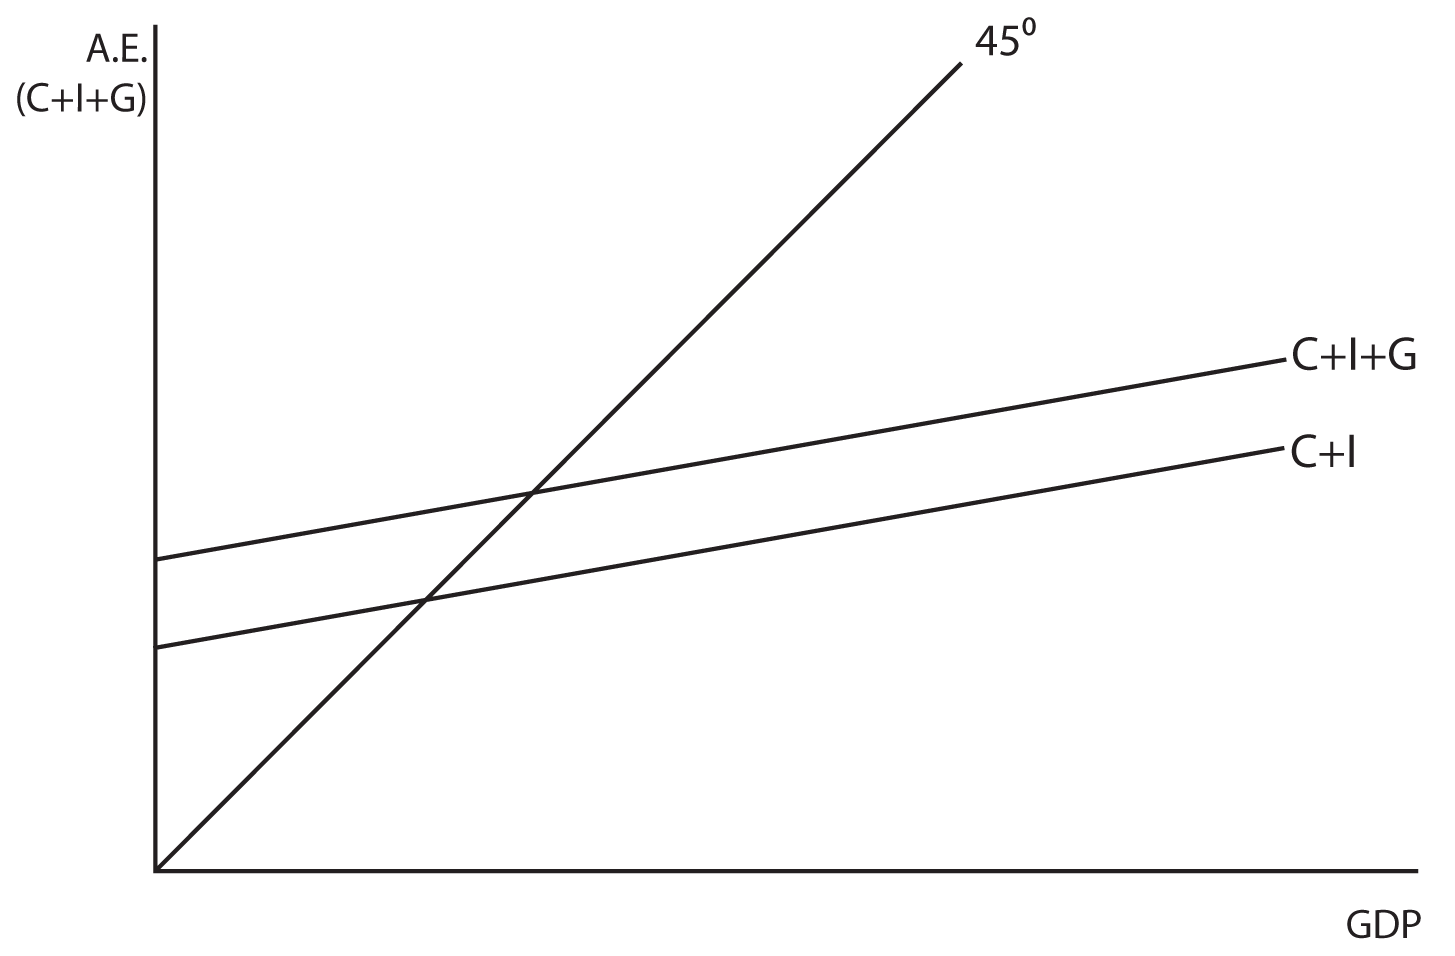 Changes in government spending have a similar impact on equilibrium GDP as changes in investment. The Government Spending MultiplierQuantitatively, the government spending multiplier is the same as the investment multiplier. A $1 increase in government spending will result in an increase in GDP equal to $1 times 1/(1-MPC). Since the investment and government spending multipliers are the same, they are sometimes just jointly referred to as expenditure multipliers.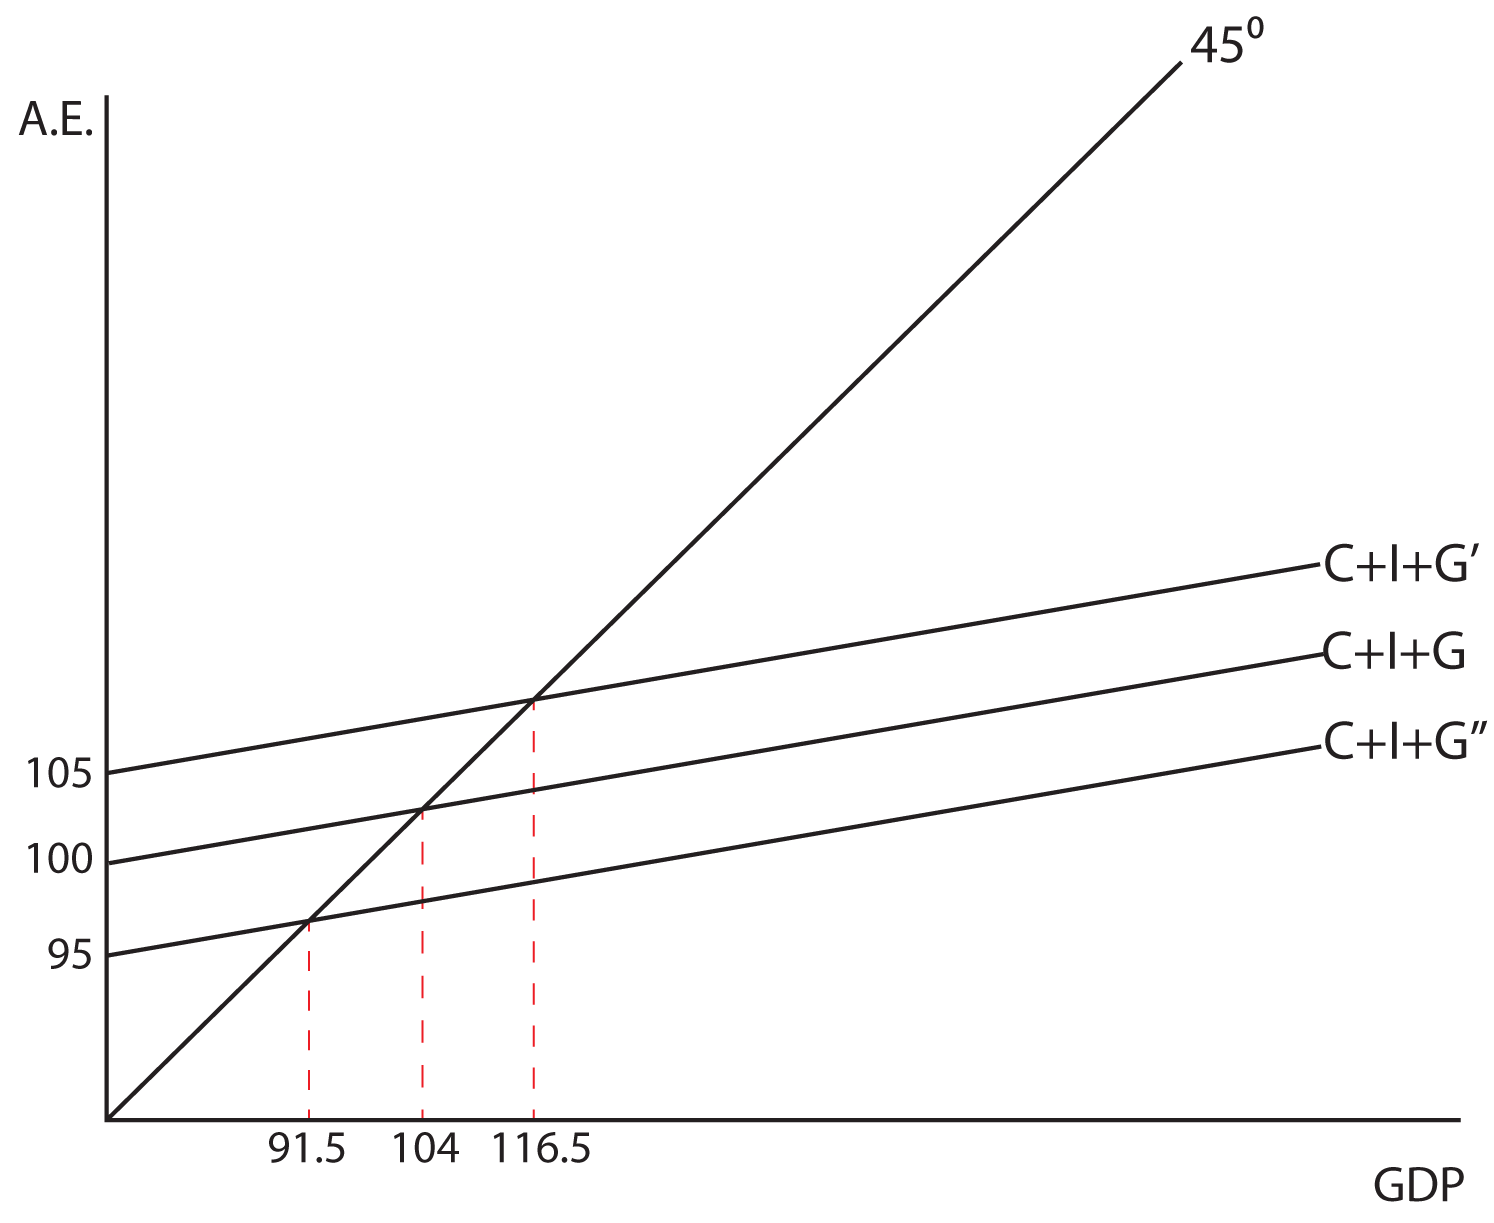
Think About It: The Effects of Government Spending
This example will illustrate the impact Keynes felt a change in government spending would have on output in the economy. Assume that the MPC is equal to 0.6. What does the government spending multiplier equal? What impact would a $5 billion increase in government spending have on equilibrium GDP? What about a $5 billion decrease in G? Can you illustrate both cases with a graph? ANSWER The Tax MultiplierAs mentioned before, the spending multipliers are all the same, 1/(1-MPC). There is also a multiplier that is associated with a change in taxes. It is called the tax multiplier, and it is NOT the same as the spending multipliers. In fact, it is smaller than the spending multipliers. Why would the tax multiplier be smaller than the government spending multiplier? The answer lies in the fact that when a business or the government undertakes new spending, they inject the initial amount of that spending into the income stream and then it multiples through the economy. When the government decides to lower taxes, they are not injecting new money into the economy; they are simply deciding not to take money out of the economy that was already in the income stream. Individuals will then spend some portion of the money that they get to keep. So, if the government increases spending by $1 billion, the entire $1 billion is injected into the income stream. If they reduce taxes by $1 billion, only the MPC x $1 billion is injected into the income stream. Therefore, the impact of the tax multiplier is:
$1(MPC) + $1(MPC)(MPC) + $1(MPC)(MPC)(MPC) + …
This progression can be shown to be equal to the spending multiplier times the MPC, or
MPC x 1/(1-MPC)
Which is simplified as
MPC/(1-MPC)
Since reducing taxes increases income and vice versa, the tax multiplier is negative, i.e.
-MPC/(1-MPC)
Let’s look at some common values of the MPC and determine the tax multiplier for each.
Note that a change in taxes shifts C in our aggregate expenditures model. An increase in taxes shifts C downward and a decrease in taxes shifts C upward with the expected impacts on equilibrium GDP.
Think About It: Production Possibilities
In the Lesson on Fiscal Policy, we will show how both government
spending and taxes (the two primary components of fiscal policy) can be
used to expand or contract the economy. Show how a change in taxes has a specified impact on GDP, depending on the MPC. Show that you can get the same answer on its impact on GDP, using the tax multiplier or the expenditures multiplier. For example, let’s say the government increases taxes by $16 Billion with an MPC = 0.75. What impact would this have on equilibrium GDP? ANSWER 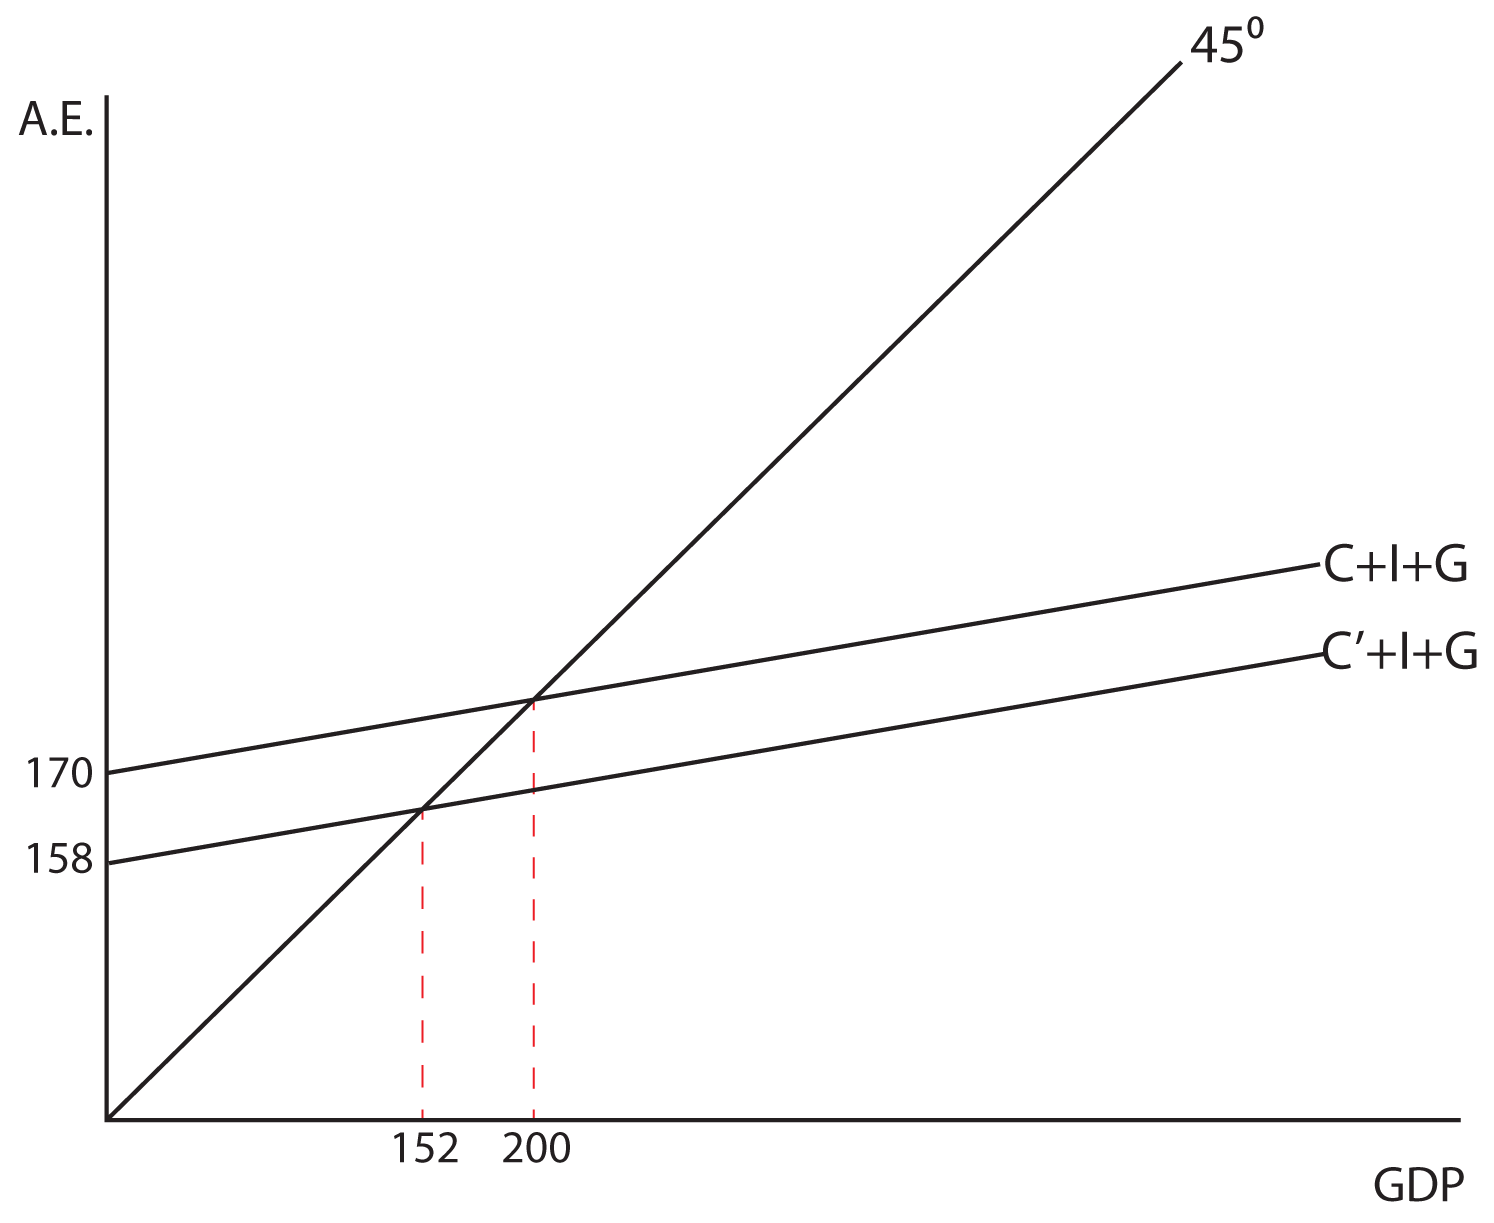 The Balanced-Budget MultiplierThe final multiplier we want to consider in the Keynesian Model is called the balanced-budget multiplier. Essentially, this multiplier tells us what the impact will be on the GDP if you increase both government spending and taxes equally. For example, if the government wanted to increase government spending by, let’s say, $2 billion, but did not want to run a deficit, and therefore also increased taxes by $2 billion. We’ll look at each of these actions independently and then put them together to find a generalized answer.Assume the MPC is equal to .8. With an MPC of .8, the government spending multiplier is 5—if the government increases spending by $2 billion, output will go up by $10 billion. If the MPC is .8, the tax multiplier is -4—if the government increases taxes by $2 billion, output will go down by $8 billion. When these two things happen simultaneously, the net effect is to increase output by $2 billion ($10 billion - $8 billion = $2 billion). So an increase in government spending by $2 billion and a simultaneous increase in taxes by $2 billion will increase output by $2 billion. The balanced-budget multiplier is equal to 1 and can be summarized as follows: when the government increases spending and taxes by the same amount, output will go up by that same amount. We can generally show that the balanced budget multiplier is equal to one, and that it is not dependent on the size of the MPC: when you sum the spending multiplier and the tax multiplier, you always get one, regardless of the MPC.
1/(1-MPC) – MPC/(1-MPC) = (1-MPC)/(1-MPC) = 1
Think About It: Calculating the Effect of the Balanced Budget Multiplier
Demonstrate both graphically and algebraically the impact on GDP of increasing government spending and taxes by $5 billion dollars when the MPC is .9. ALGEBRAIC ANSWER GRAPHIC ANSWER Section 03: The Recessionary and Inflationary GapsLet’s say that GDP = 1400 is the full employment output, or the equilibrium level we would like to obtain. Also assume that the MPC is equal to .6. If the economy was actually producing 1300 and the government wanted to implement policies to increase output to 1400 they would need to increase government spending by 40. This additional 40 in government spending is called the recessionary gap.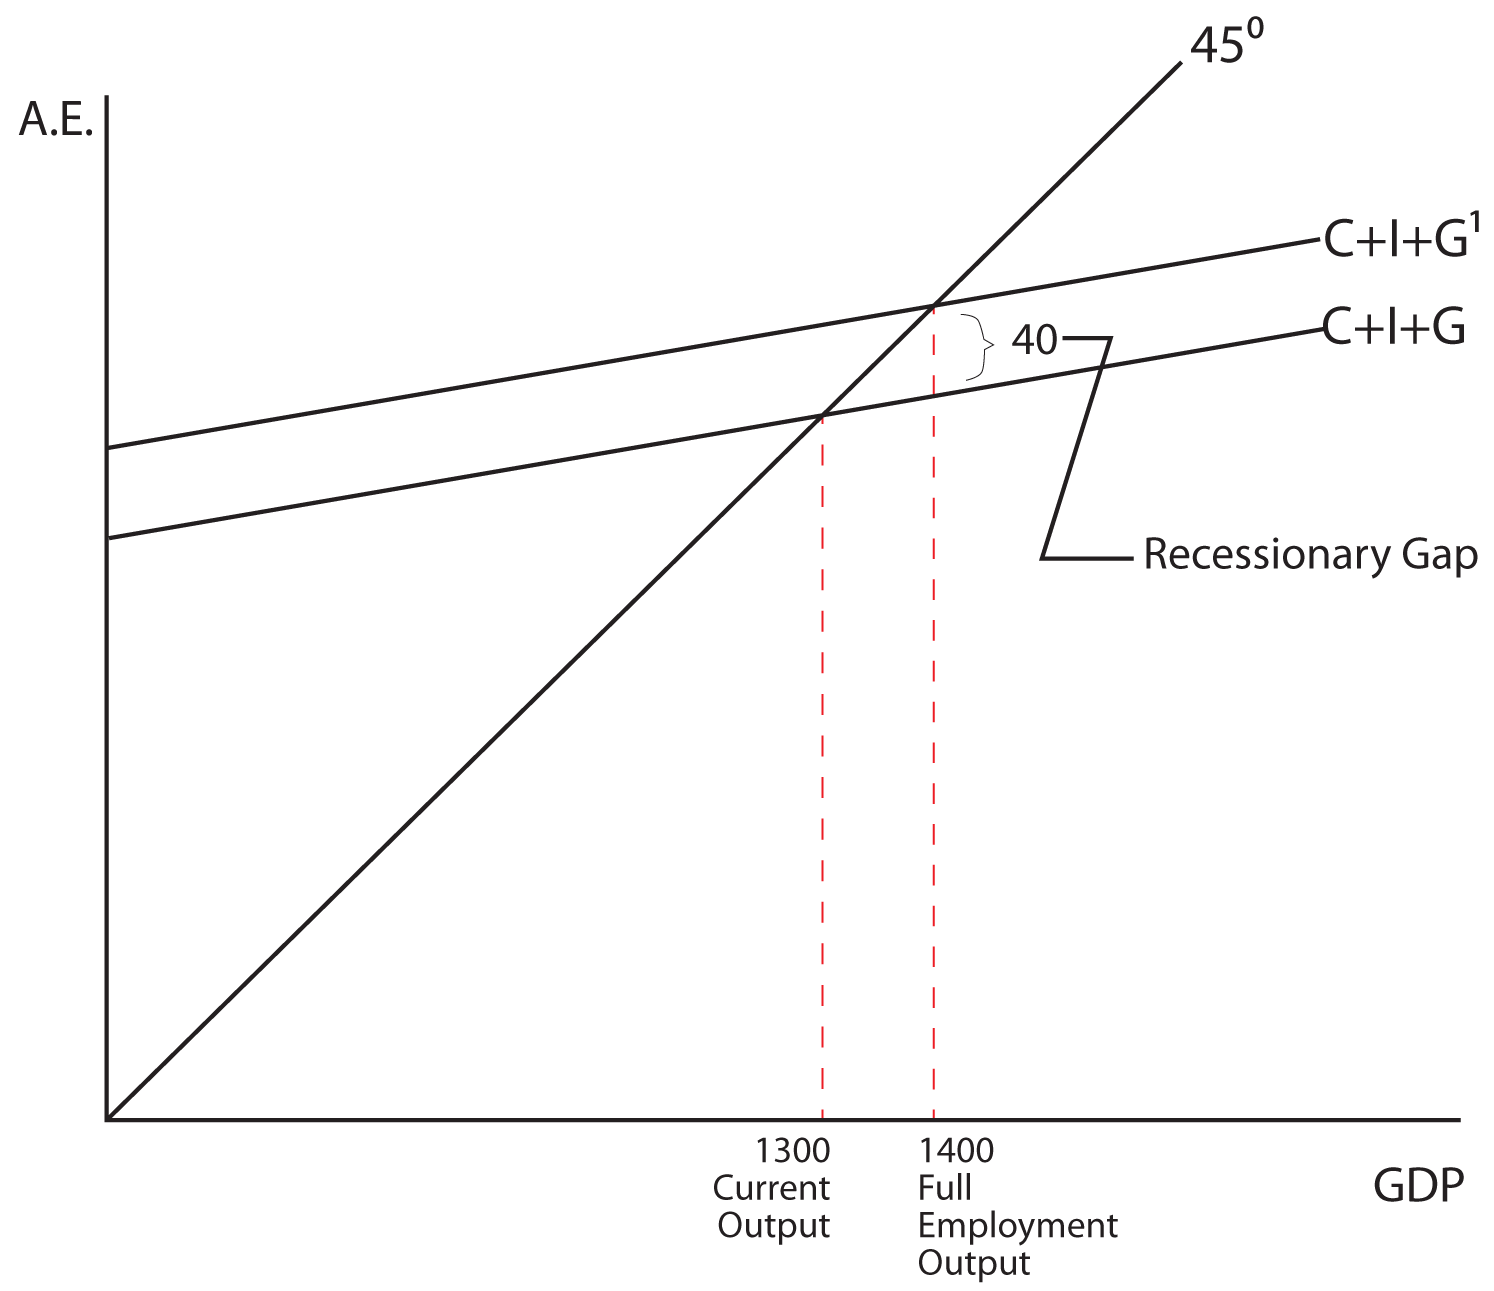 To change output in the economy from 1500 to 1400 you would have to reduce G by 40. In this case, the 40 in government spending is an inflationary gap. 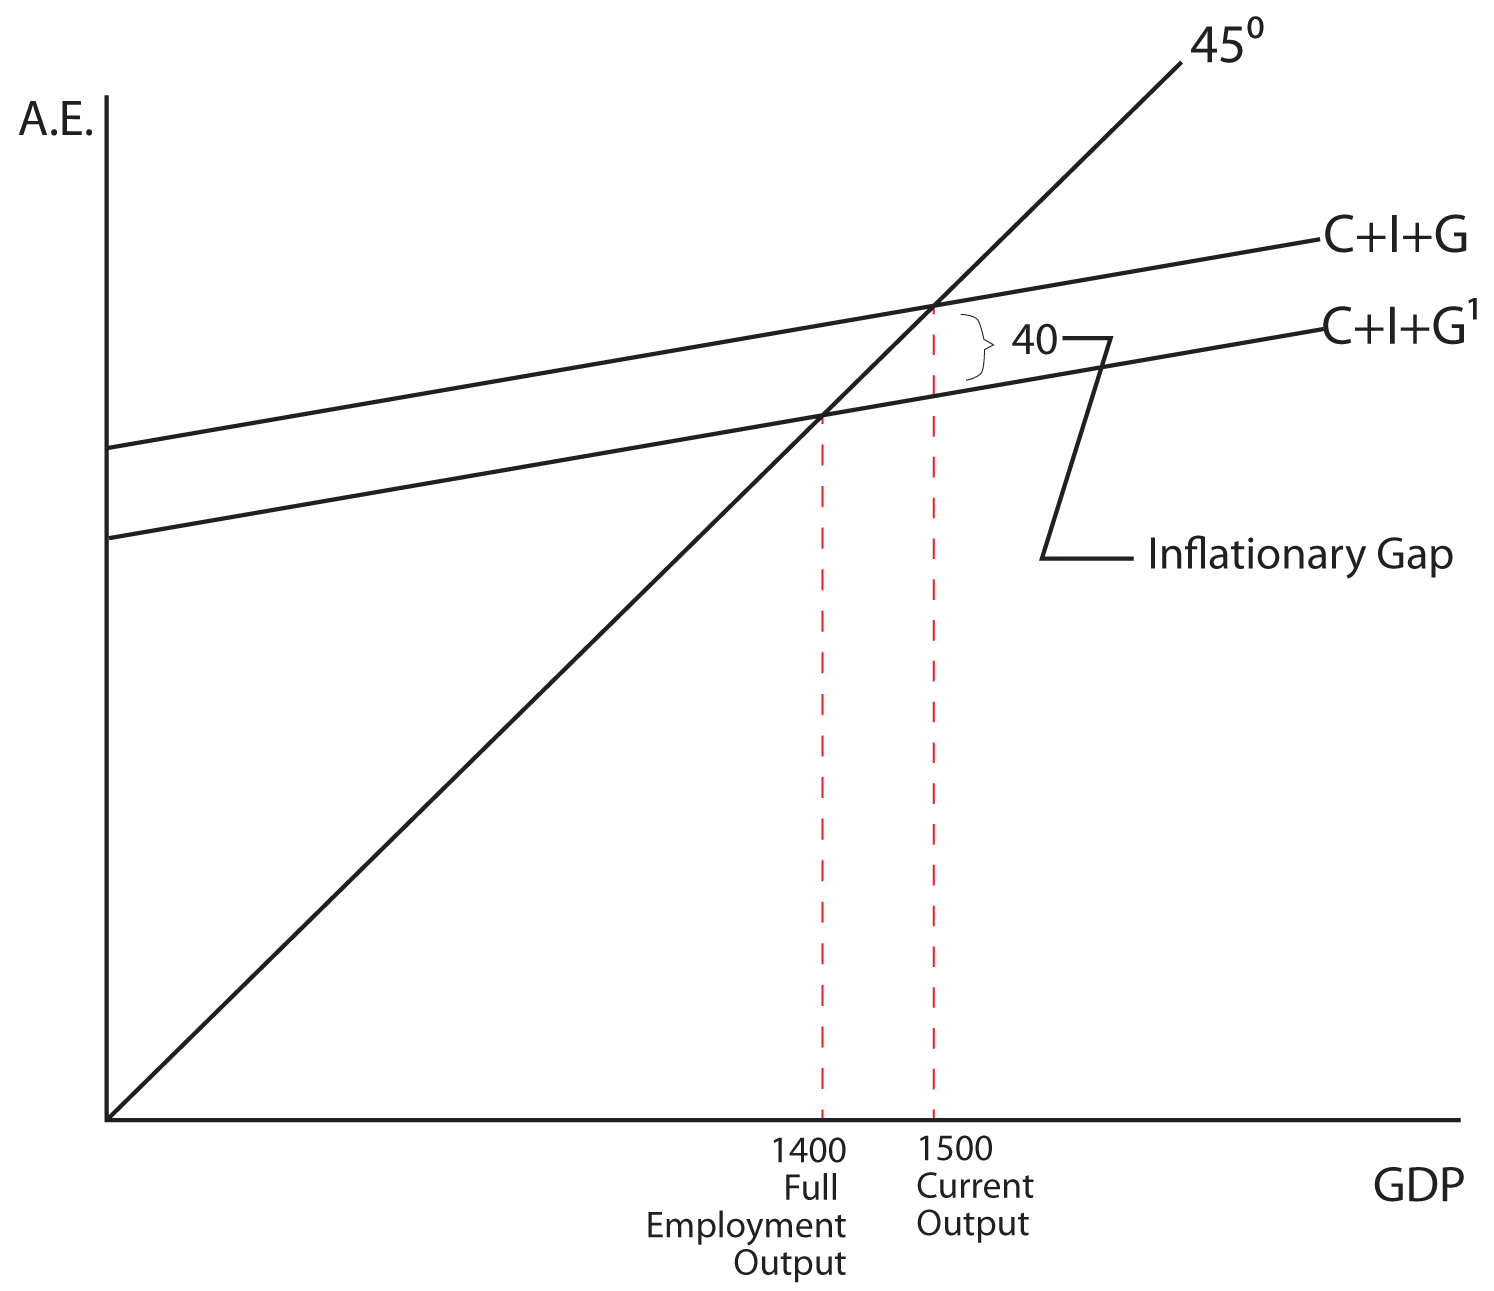 When G is used to increase output, it is called anti-unemployment policy and when G is used to decrease output it is called anti-inflationary policy. Net exports and Equilibrium Output If we add international trade to our analysis and assume that net exports are independent of the level of GDP, then equilibrium GDP will be determined by where the C+I+G+NX line intersects the 45 degree line in our standard model (see the graphs below). Changes in NX have a similar impact on equilibrium GDP as changes in investment or government spending have. For example, if the MPC were equal to 0.5 and there were an increase in NX equal to $15 million, the output would increase by $30 million. This is true because the multiplier would be equal to 2.  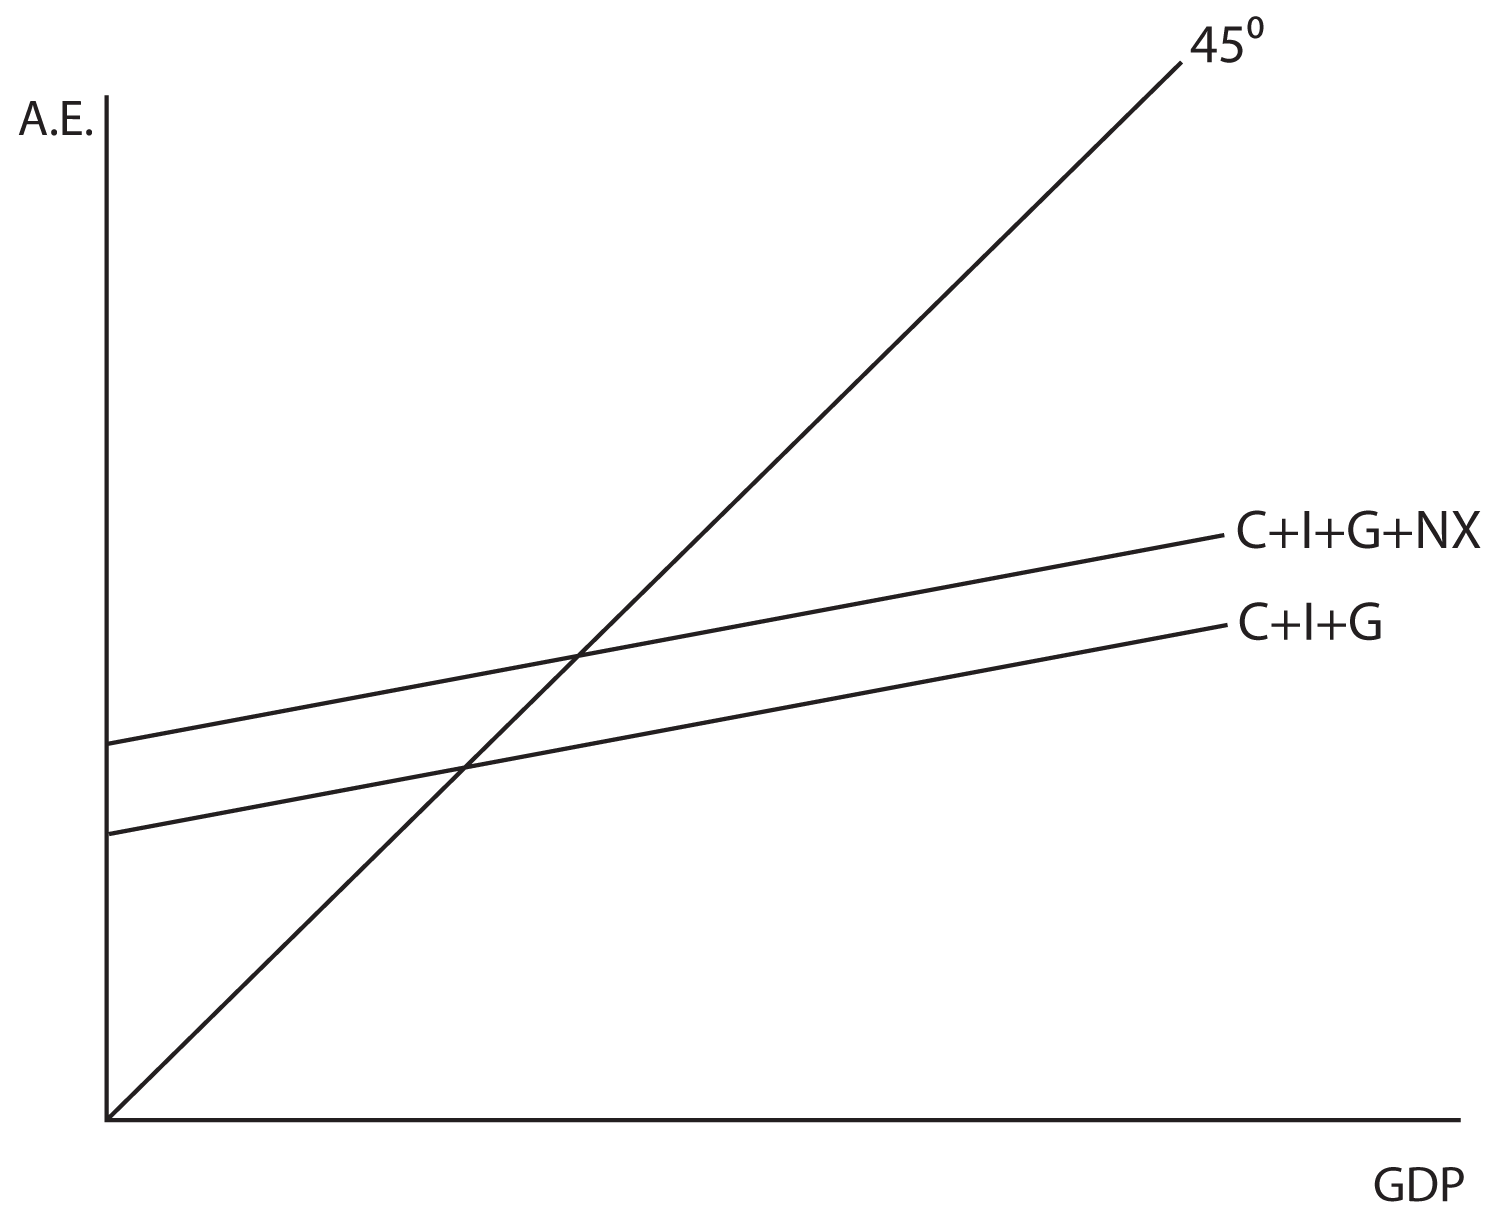
© Copyright 2011 by BYU-Idaho. All Rights Reserved.
|
||||||||||||||||||||||||||||||||||||||||

The Study Economics...we provide notes for ignou ma economics econometrics microeconomics macroeconomics mathmatical economics and support for research in economics in dynamics markets
Saturday, October 12, 2013
What microeconomists think about macroeconomics
What microeconomists think about macroeconomics
There
is a lot that is interesting in Diane Coyle’s 2012 Tanner lectures.
What I want to respond to here is an associated post,
where she expresses some of the frustrations that I know many microeconomists
have with macroeconomics. These can be summed up rather crudely as: why do we
disagree all the time, and yet appear so sure we are right, and don’t we
realise we are bringing the whole discipline into disrepute? Diane says that “macroeconomists
simply do not realise how low their stock has sunk in the eyes of their
microeconomist colleagues”. This
may
be an exaggeration, but who knows what is said when we are out of
earshot.
Because I (and pretty well all macroeconomists) do have great respect
for our microeconomic colleagues, we have some explaining to do.
(Jonathan Portes has
an excellent post
responding to some of the more specific comments Diane makes in this post.)
What I
want to say in summary is this. Microeconomists are right in many of their
criticisms, but what they often fail to see is the root cause of the problem.
This is that macroeconomic policy is highly political, with strong ideological
implications. Ideology and politics distort macroeconomics as a science. Yet
despite this, there is – and for many years has been – a substantial body of
analysis that most macroeconomics would sign up to, and which has
sound empirical backing.
What is
this substantial body of analysis? It is what used to be called the new neoclassical
synthesis (Goodfriend and King (1997) – see here
for more background and references). For a closed economy, its details are well
represented in Romer’s graduate textbook, for example. This body of analysis
has important gaps and omissions, of course, such as a naive and simplistic
view of the financial sector. However, as I argued recently,
the financial crisis itself showed up this incompleteness, but did not
invalidate most of what was in the synthesis. Indeed, events since the crisis have
provided significant empirical support for the Keynesian elements of that
synthesis. (Of course, there are caveats, some of which I have discussed in earlier posts,
and which I will return to below.)
So why
the appearance of constant disagreement among macroeconomists? The first point
to make is that the disagreement tends to focus on one part of the synthesis,
which is short term macroeconomic fluctuations: their causes and cures. This is
not the only part of the synthesis which has the potential for political and
ideological controversy, but it is where there is constant popular and media
interest. The second point, however, is that politics alone is not sufficient
to explain controversy within a scientific discipline. Here I might give
climate change is an example: despite strong pecuniary temptations, climate
change science is pretty united, and typically dissenting views come from outside
the discipline.
The
reason, I would suggest, why many macroeconomists do not sign up to the new
neoclassical synthesis is that its Keynesian component conflicts with an
ideological view which uses economics as part of its intellectual foundation. That
view is that markets generally work well when left free from political
interference and that government intervention is almost always bad. Now most microeconomists
will immediately point out that microeconomic theory as a whole does not
support this ideological view. Much microeconomic analysis is all about market
imperfections. But that misses the point. Those attracted to this ideological
position use a very partial take on economics for support, and are naturally
attracted to that part of the discipline.
Keynesian
analysis is all about the consequences of one particular market imperfection. Conventionally
this is seen as the externalities that arise from sticky prices. (I personally am
increasing drawn to describe them as the consequences of the existence of money,
but that is a different story.) It implies in general the need for constant
involvement of one arm of the state – the central bank – in stabilising the
economy, and in some circumstances the involvement of fiscal policy to do the same.
I have argued
that this analysis leaves those with the ideological view that free markets are
good and government intervention bad feeling very uncomfortable, so they will
try and find ways of avoiding and disputing this part of the synthesis.
Now
nothing I have said so far makes macroeconomics unique in attracting
ideologically driven controversy. There are areas of microeconomics which are
equally controversial for similar reasons. I would suggest the debate over
minimum wages is an example. An outsider looking at this debate might well
conclude that labour economists are as equally disputatious as macroeconomists on
this issue. Another example from my youth I always like to use is the ‘Cambridge
controversies’ over ‘reswitching’. This was a highly technical theoretical dispute,
but its ideological implications were such that views on this technical debate
were highly correlated with political beliefs.
I think
there is one factor that is peculiar to macroeconomics, and that is the role of
‘city’ economists. There are two elements here. One is that city economists
work in an environment which has a strong vested interest in promoting the free
market ideological view. The other is that part of the name of the game for
these guys is to differentiate the product. These are of course tendencies:
there are many excellent city economists who go with the evidence rather than
with ideological conviction.
Why is
it important to say all this? First, because the influence of ideology on
economics is not confined to macroeconomics. It is also not confined to the
political right, so there is no simple bias, but recognition rather than denial
is important. Second, the cure – if there is one – is evidence. As Jonathan
points out, the recent evidence is clearly with those who accept Keynesian
views, but I think there is an underlying problem. The way empirical evidence
is marshalled in the microfoundations methodology associated with DSGE
modelling makes it too easy
for those who hold ideologically based priors to retain and defend those priors,
which is one reason why I have tried
to suggest that it should not be the only way serious macroeconomic analysis is
done.
Sustainable Development
Sustainable Development
What is in this guide?
This guide is meant to provide a basic understanding of sustainable development and a practical guide to sustainable development. It has the following sections:
- What is sustainable development?
- Striking a balance between preserving our limited natural resources and overcoming poverty
- 25% of the population of the world consumes 75% of its natural resources annually
- Sustainable development is beginning to take root globally
- People, development and the environment 5.1 The world as an ecosystem
5.2 Natural resources are necessary to sustain life on earth
5.3 Development and its dependence on natural resources
5.4 Sustainable use of resources
5.5 Who uses the most resources?
5.6 Our consumer society
5.7 Population growth and natural resources
5.8 Will the world run out of resources soon?
5.9 Towards sustainable development
- A practical guide to sustainable development
6.1 Building homes in such a way that they are warm in winter and cool in summer (thermally efficient)
6.2 Use energy efficient devices in homes
6.3 Use the right energy source for the right activity
6.4 Composting toilets
6.5 Biogas digesters
6.6 Grey waste water system
6.7 Rainwater harvesting
6.8 Landscaping
6.9 Waste recycling
- President’s speech
A definition of sustainable development can be: to meet the basic needs of people today without ruining the chances of future generations to do the same.
In earlier modules we learnt that development can occur when economies are strong and can provide for all the people in a country. In South Africa, where so many people are presently living in poverty, we need economic growth before our economy will be able to provide sufficient resources to overcome poverty.
Economic growth also has to be greater than population growth otherwise more and more people will form part of the poor. In the greater global environment there is a serious concern whether economic growth all over the world is sustainable. The main concern is around environmental issues. As more and more people populate the planet they consume more food and use up more of the earth’s natural resources. Economies have to grow to look after the increasing numbers of people and economic growth is very often at the cost of environmental protection.
In 2002 the World Summit on Sustainable Development was held in Johannesburg. For the second time (the first summit was in Rio) the world came together to see how the planet’s resources could be sustained while at the same time sufficient development could take place to overcome poverty and underdevelopment.
There are serious resource constraints in the world. Fresh water, clean air, fish stocks, land for food production and living space are all under pressure because of the world population’s increasing consumption and pollution. Economic development and consumerism also threatens natural resources like forests, minerals and rivers.
There are no simple answers to how to build sustainable development whilst overcoming poverty. South Africa has many examples of problems we face to make development sustainable. We are rapidly increasing the access to water and electricity for poor people. This will greatly increase the amount of water we use and the amount of electricity we have to produce. As the economy grows there will be increasing pollution and pressure on natural resources. Government has to balance the need for development with the sustainable use of resources.
One of the key issues that affect sustainability is over-consumption by a portion of the world’s population. At the moment about 25% of the world’s population live in relative comfort and consume a huge percentage of the world’s resources in the process. These are the people who live in large houses, often have at least one car per family, consume highly processed and packaged foods and luxury consumer goods like TVs, sound systems, air conditioners and so on. They have dozens of different sets of clothing and spend a lot on leisure activities. They create a huge amount of waste and pollution and consume more than half the natural resources the whole world uses every year.
A further 35% of the world’s population live in a more sustainable way where they do not over-consume. These people are characterised by living in small households, often built by using immediately available natural resources. They tend to use public transport or bicycles and eat less packaged and refined foods. They do not consume a lot of luxury goods and have only a few sets of clothing. They do not create a lot of waste.
The last 40% of the world’s population can be classified as under-consumers. These are people who most often live in rural areas in developing countries. They have only one or two sets of clothing, use animals or their feet as their main form of transport, often grow their own food and produce almost no waste. Other than basic items like flour, salt, sugar and oil, they consume very little that they do not produce themselves.
The people on this planet can survive on the available resources if all of us lived like the middle 35%. Unfortunately, life in the top 25% consumes about three quarters (75%) of the natural resources used annually. If we see overcoming poverty as moving everyone into the same sort of lifestyle as the over-consumers the earth will not be able to sustain development at that rate for very long.
It is very important for us as development workers to consider the impact of development on the environment and the sustainability of any development in terms of environmental and other factors.
Most countries in the world have accepted that sustainable development is an essential development pathway and are busy incorporating its principles into their own policies and programmes. The United Nations has taken sustainable development very seriously and it has established specialist units to deal with the issue and to identify opportunities and activities to support this development theory.
Sustainable development in itself is not a political theory but it has been recognised that without political change, sustainable development is not possible. A rampant capitalist society, where the rich have all the access to wealth and resources and where the only thing that matters is economic growth and profit, cannot support sustainable development. Social democratic states where issues of people’s health and welfare are paramount in the development cycle are better placed to support sustainable development. This is why the South African political model is well placed to support sustainable development and the ideas encompassed within the sustainable development debate have begun to be merged with all policies related to development. We are also fortunate to have a constitution that protects people’s rights to a clean and healthy environment.
The challenge now is to mainstream sustainable development thinking and to find sensible and simple solutions to our challenges. The beauty about sustainable development is that it really is very simple and people have been practising it for centuries. The next section will try to explain a lot of the jargon and give a summary of the theory, debates, issues, developments and ideas in simple terms. A later section will provide the learner with examples of programmes where sustainable development is being implemented and a practical guide for some simple things we can do as individual and development practitioners to make sustainable development happen in our communities.
5.1 The world as an ecosystem
The relationship between people and ecology is very important for how the world survives. People are a part of large biological system (ecosystem) made up of every living organism in the world and indeed the universe, which interacts to make life as we know it. These organisms also interact with the non-living parts of nature such as climatic cycles and solid matter. This ecosystem is carefully balanced and each part is interdependent on the rest. Before industrialisation, this system was able to deal with its growth and its waste in a way that did not interfere with any other organism’s ability to thrive.
Generally, the richer the person is, the more access he/she has to the earth’s natural resources and the greater their ability to disturb the balance of the earth. Indeed, humans have begun to act as if they control the system and can manipulate it, as they want, without any consequences. In this chapter we will explain how this is not the case and that human beings will have to alter their approach to the way they exist in the world if they want to remain a thriving part of its carefully balanced ecosystem
5.2 Natural resources are necessary to sustain life on earth
Although this may seem obvious, many of us do not fully consider how important our natural resources are and how life without them would not exist. We often do not consider what nature provides for us on a daily basis. Think about life without air, water, light and food.
Natural resources can be classified into those that are renewable and those that are not renewable. The renewable resources are not limited. For instance sunlight, wind, tidal energy and wave energy. These are examples of natural resources where we cannot imagine a time when we will not have an abundance of such resources.
But there are also other renewable resources such as trees, plants, crops, and in fact all growing matter on earth. These are renewable because they can grow again and again. Our only limitation in making them grow would be availability of water and land and in extreme conditions, sunlight.
Non-renewable resources are those that are stored in our biosphere in one way or another and that take many thousands or millions of years to make. Examples of this are all the metals like iron, aluminium, gold and platinum. More importantly, we use some resources like coal, oil and gas every day and they are not renewable. When we have used them up, they are gone. They have taken millions of years to be deposited in the ground and we are digging them up. Some people have described our use of non-renewable resources like this as “squandering the earth’s savings”. During the 20th and 21st centuries we would have used up most of the earths most valuable resources and we are not leaving any of these resources for use by future generations.
Water falls into an interesting category all on its own. Fresh water is generated through the water cycle, of rain, mist, evaporation and snow. It is dependent on the climatic cycles and some places in the world have more water than others. However, if we mess with our climate, we will seriously affect our ability to keep on producing the water we need in densely populated areas. Fresh water supplies are limited on the earth and through our wasting and polluting water, we are compromising our ability to sustain these resources for the thousands of years to come.
Land is also a natural resource and with an ever-increasing world population, it becomes scarcer. Since the earliest times, people have fought wars over land. The usefulness of land for development and to sustain life is also dependent on natural cycles like rainfall and climate. Land is also power and this power lies in the hands of a few, creating imbalances throughout the world. These imbalances cause poverty and general decay of quality of life.
5.3 Development and its dependence on natural resources
The distribution of natural resources in the world is not equal or fair. The oil producing countries like Iraq, the US, Nigeria and other smaller countries like Norway have the greatest share of fossil fuels while some other countries have no fossil fuel resources to speak of. Water, a valuable natural resource is scarce in South Africa, but she has abundant coal and sunshine. South Africa is also richly endowed with other natural resources like metals (gold, platinum), and wildlife.
However, this distribution of natural resources is not the only inequality in the world. The rich “own” much more of the natural resources than the poor. Land is generally sold to the highest bidder; privately owned oil companies like Shell, BP and Texaco “own” the oil we buy.
Money has become the currency for the purchasing of natural resources, not fairness and equity. If you are rich you can buy lots of electricity generated through the South Africa’s vast coal reserves that cause pollution and environmental degradation. The rich can purchase fresh water whenever they want yet the rural poor walk miles to fetch water, which is often polluted upstream by farmers and industrialists who use chemicals and wash the waste from their processes into rivers.
We are degrading our natural environment every day. Using low-grade coal causes the thick smoke you see hanging over poor townships in urban areas. Industrial illegal dumping is common. Rural areas are less affected by this more visible pollution, but continue to suffer in particular with polluted streams and rivers. The rural poor are forced through circumstances to denude forests for firewood to cook with. As we pollute our fresh water supply, we need to find more sources of this scarce resource in our country.
But there is a more serious impact of all our pollution, which is only becoming noticeable over the past twenty years or so although it was first described as far back as 1827. It is called global warming or global climate change and it is a direct result of burning massive amounts of carbon products like coal and oil. This carbon is escaping into the atmosphere and it is causing the world’s climate to change. It does this by forming a thick layer of gases, which trap the heat of the earth inside its atmosphere not allowing it to escape. The result of this so-called “greenhouse effect” is that the earth climate is changing. We are seeing more droughts in some places,
The United Nations has taken it on, as one of its more serious issues. The UN Framework Convention on Climate change (UNFCC) was signed in 1992 at the Earth Summit and the Kyoto Protocol which provides for a method for implementing some of the ideas in the Convention is being discussed yearly at Special United Nations meetings. The consensus among the scientists is that our use of fossil fuels is causing the global climate to change and this will have serious impacts on the ability of the earth to sustain life as we know it.
The impacts of climate change will vary from region to region. The British Weather Office has predicated that 80 million people in Asia could be flooded due to climate instability and since their predication there have been floods in Mozambique, Bangladesh and Orissa. Some small island states might disappear altogether when the polar ice caps start melting and sea levels rise. The predications for South Africa are:
- We will experience more droughts and therefore the deserts will creep closer to settlements impacting especially on the ability of the rural poor to survive.
- This impact will spread to the urban areas as we lose good arable land and even reduction in our fresh water supply as the rain cycle is interrupted.
- The higher temperatures might impact on some diseases like malaria that thrive in warmer climates.
- We will lose some of our valuable biological diversity that is carefully tuned to life on earth as it is and will not be able to survive and adapt to the warmer climes.
5.4 Sustainable use of resources
The way development takes place at the moment is extremely wasteful of natural resources. We use 10 litres of water to flush a toilet where mostly the sanitation waste is itself only water anyway. We use coal to generate electricity and we lose 30% of the energy generated to losses that take place at every point of the generation cycles, transmission, distribution and end use. Other energy sources are far better for many of our needs and yet we mostly rely on electricity. For instance, gas is much better for cooking and yet we promote the use of electricity for cooking.
In the rural areas, people are far less wasteful of natural resources. This is because they often do not have access to the type of services that you can get in an urban area. Although we believe that people should have access to fresh water and a hygienic sanitation system, we must continue to explore the most efficient ways of providing these.
For instance we should see rain water as valuable and try to keep it on our land for as long as possible by storing it in rainwater tanks, for example. If we did this, we could save money on the purchase of water by using it for growing vegetables and even for flushing toilets and cleaning floors. But in urban areas, we spend millions trying to move water that lands on ground out of the area through building huge storm water systems and bulk infrastructure. Section 6 of this guide provides some practical and new idea for dealing with these issues.
A lot of people don’t even know how they could save on resources. For instance, insulating a home can save as much as 40% of the total energy bill of the home! And insulting an electric geyser with a blanket could save 20-30% of the cost of the electricity used in a home. Energy efficient lights bulbs are also energy saving (20%). These savings are in real cash, and could make a big impact on poor households. But we continue to build homes without ceilings and insulation and we don’t provide homes with low flush toilets and showerheads.
Section 6 of this guide is a practical guide for using our natural resources wisely and efficiently. These measures need to be mainstreamed into development practise where they impact positively on poverty alleviation and sustainable development
5.5 Who uses the most resources?
It is a fact that it is the rich who pollute the most, not the poor. It is also the rich who use more of the worlds natural resources, both renewable and non renewable. A poor home will use about 150 Kw of electricity per month whereas a middle income home will use as much as 2000 Kws of electricity.
By far the biggest users of energy resources are industry, which use 45% of all the energy consumed in South Africa. Although industry only uses about 12% of all the water, agricultural irrigation uses 51% of all water available.
Atmospheric pollution is mostly a result of industrial discharge, in particular from some of the more dirty industries like Sasol, Eskom and the petroleum industries in the south-Durban areas. Vehicles add a lot of air pollution. Residential pollution accounts for about 10% of all discharge.
Rapid urbanisation is making a big difference to the use of our resources. More than half of South Africa’s population of 44 million live in urban areas and of these about 70% live in formal settlements with proper services. Compared with rural dwellers, city people have much higher levels of consumption of water, energy and manufactured goods. At the same time the concentration of people in a small area makes it possible to plan properly and deliver services in a more efficient way. Saving of energy and water on such a massive scale could have an enormous positive impact. Design of proper transport systems could also mean huge reductions in pollution levels and the release of greenhouse gases. Section 6 provides some ideas for how we could alter the development methods to provide solutions rather than problems.
5.6 Our consumer society
The consumption versus production debate is raging in the world. The world could not support its population if they all consumed like Americans. There are simply not enough resources on earth to do that. The biggest consumers have to accept that in order to reduce poverty in the poorer countries, they will have to consume less of everything, not just natural resources in their pure forms, but also man made products from manufacturing cycles. The following information is provided to demonstrate clearly the disparities and to highlight the urgent need for change. Development is not just about giving those who have less more; it is about making sure that future development is done more responsibly. In other words, we should develop so that protecting, saving and enhancing our natural resources is part of the deal.
The information that follows comes from an organisation in the United States called the Worldwatch Institute, set up to highlight the consumption patterns of the world.
The world today produces and consumes more than ever before. Modern industrial workers now produce in a week what took their 18th century counterparts four years. Private consumption expenditures—the amount spent on goods and services at the household level—topped more than $20 trillion in 2000, a four-fold increase over 1960.
One quarter of humanity—1.7 billion people worldwide—now belong to the “global consumer class,” having adopted the diets, transportation systems, and lifestyles that were once mostly limited to the rich nations of Europe, North America, and Japan. Today, China, India, and other developing countries are home to growing numbers of these consumers.
Yet the world is one of contrasts. While the consumer class thrives, great inequalities remain. As many as 2.8 billion people on the planet struggle to survive on less than $2 a day, and more than one billion people lack reasonable access to safe drinking water. The 12% of the world’s population that lives in North America and Western Europe accounts for 60% of private consumption spending, while the 33% living in South Asia and sub-Saharan Africa accounts for only 3.2 percent.
People must consume to survive, and the world’s poorest will need to increase their level of consumption if they are to lead lives of dignity and opportunity. But the world cannot continue on its current path — the earth’s natural systems simply cannot support it. The economies of mass consumption that produced a world of abundance for many in the 20th century face an entirely different challenge in the 21st century: to focus not on the indefinite accumulation of goods but instead on a better quality of life for all, with minimal environmental harm.
The division in spending between luxuries and necessities is growing. Here are some interesting facts:
Region Share of World Private Consumption Expenditures Share of World Population United States and Canada Western Europe East Asia and Pacific Latin America and the Caribbean Eastern Europe and Central Asia South Asia Middle East and North Africa Sub-Saharan Africa
- In 2002, 1.12 billion households—about three quarters of the world's people—owned at least one television set.
- Some 41 million passenger vehicles rolled of the world's assembly lines in 2002, five times as many as in 1950. The global passenger car fleet now exceeds 531 million, growing by about 11 million vehicles annually.
- Consumers across the globe now spend an estimated $35 billion a year on bottled water.
- In 1999, some 2.8 billion people—two in every five humans on the planet—lived on less than $2 a day.
- In 2000, one in five people in the developing world—1.1 billion total—did not have “reasonable access“to safe drinking water.
- 2.4 billion people worldwide—two out of every five—live without basic sanitation.
- Providing adequate food, clean water, and basic education for the world's poorest could all be achieved for less than people spend annually on makeup, ice cream, and pet food.
Table3: Annual Expenditure On Luxury Items in Developed World Compared With Funding Needed To Meet Selected Basic Needs in Developing World (WORLDWATCH) Product Annual Expenditure Social or Economic Goal Additional Annual Investment Needed to Achieve Goal Makeup $18 billion Reproductive health care for all women $12 billion Pet food in Europe and United States $17 billion Elimination of hunger and malnutrition $19 billion Perfumes $15 billion Universal literacy $5 billion Ocean cruises $14 billion Clean drinking water for all $10 billion Ice cream in Europe $11 billion Immunizing every child $1.3 billion 5.7 Population growth and natural resources
The world's population is growing fast but the use of resources is growing even faster - at an exponential rate. In 50 years time, at the current rates of population growth, we expect a 41% increase in the world population to a staggering 8.9 billion people. If we look at some world figures from the past 50 years, we can see some trends that are worrying.
Between 1950 and 2000 the following has taken place globally:
ITEM INCREASE World population 2 x more Energy use is now 4 x more Number of automobiles 10 x more Paper use 7 x more Wood use 3 x more Water use 3 x more Fish catch up 5 x more Disaster relief budgets 10 x more (due to global climate changes) 5.8 Will the world run out of resources soon?
Most of our energy currently comes from sources that are not renewable, like coal, oil and gas. Although South Africa has an abundance of coal it does not have not liquid fossil fuel resources like oil at all. And oil and its by-products (petrol and diesel) are essential for most of our transport and agricultural equipment. Many experts in the world say that over the next 50 years our oil resources will be in very short supply and within 30 years we will feel the limitations very severely. Many people are asking how we can feed 8.9 billion people without these resources and the doomsday prophets are suggesting that billions of people will die.
If we take action soon and in the right way, we can avoid any catastrophe and set the world on the right path. The solutions to all of these problems exist and are working in various ways all around the world. It is up to us to ensure that these practices are promoted and encouraged and used by development practitioners affordably and efficiently.
5.9 Towards sustainable development
We have now heard about some of the challenges that exist and what they mean to South Africa and the world. We have also heard that there are solutions to these issues and that they can in fact be quite simple. Political will, properly trained development practitioners, resources allocated to alternatives and people working together towards sustainable development can make it happen. This section will introduce you to some of the history behind sustainable development and how South Africa is currently placed to implement these measures.
“Sustainable Development” is a conceptual and practical approach to tackling poverty, social inequality and environmental degradation and it is a relatively new term and concept. It grew out of a worldwide movement that recognised that development patterns were focusing on economic growth and accumulation without considering how this was impacting on our natural resource base. Little value was placed prior to the 1970s on resources like fresh air and clean water. It is only very recently that humans have begun to understand that the earth’s bounty was limited and that we are not utilising her resources in a way that would allow us to sustain life on earth.
From 1972 onwards the world started waking up and a UN Commission on Environment and Development was set up after a UN convention was held in Stockholm. This was followed by the Earth Summit in Rio in 1992 and the World Summit on Sustainable Development in Johannesburg in 2002.
The Earth summit resulted in a number of important developments. Firstly the Framework convention on Climate change was signed, as was the convention on biological diversity. But a most significant event was the adoption of Agenda 21 ( the agenda for the 21st century), which outlined in concrete terms ways in which the world could move towards the implementation of sustainable development practices. Local agenda 21 was described in one chapter of the Earth Summit report and is dealt with more fully in a later section.
The United Nations has continued to address sustainable development at a very high level and in 2000 it developed, together with its member states, the Millennium Development Goals.
This is a simple practical guide on how you can implement sustainable development in your community or home.
Although sustainable development might sound complicated, it is not. The real question is:
‘ how do we make sure that we can all have a good quality of life without disturbing natures delicate balance, making sure that everyone has a fair share in our resources and that future generations are assured of the same quality”.
This section of the guide gives you practical examples of how to implement sustainable development and still achieve the stated objective above. This is not complicated science; it is simple basic, common-sense actions that can make a huge difference. This can be done on an individual level in your own home, but also in the communities that you are helping to develop.
The great thing about sustainable development is that because it saves natural resources, it generally saves you, and communities involved in these activities, money too. However, we might sometimes have to put some additional capital into our in home-building in order to gain the advantage of spending less money paying for natural resources.
In this guide we deal with:
- Building homes in such a way that they are warm in winter and cool in summer
- Energy efficient devices
- Use the right energy source for the right activity
- Composting toilets
- Biogas digesters
- Grey waste water system
- Rainwater harvesting
- Landscaping
- Waste recycling
6.1 Building homes in such a way that they are warm in winter and cool in summer (thermally efficient).
Traditional homes made from mud brick are very much more thermally efficient than cement brick homes. However, new technologies nowadays allow you to build homes from clay that have the same strength (or better) than cement. The added advantage is that you use local resources for this and so it can be cheaper if they are readily available. We should be encouraging this type of building in rural areas where cement is not readily available and clay is abundant. Nowadays, through improved technologies we can build houses using clay and yet the house can look like a standard “brick” home and even last longer.
By installing a ceiling and putting insulation in the roofs of houses, there can be savings made on heating homes. Even if the community cannot afford to heat homes, the houses will be warmer. In a heated home, such ceilings and insulation can save 40% of the energy costs.
Build homes to face the sun – i.e. north facing. We all know how lovely it is to walk into a nice warm sunny room in winter. If we build our homes to face the direction that the sun faces, we can start off on a winter’s evening with a warm home already. This is much easier to heat. Large windows on the north side allow more sun in. In summer, because the sun is higher in the sky, you can deflect the suns rays very easily by adding in an overhang over the top of the windows.
6.2 Use energy efficient devices in homes
Energy efficient light bulbs last for up to five years and use 30% less electricity. This means that if you normally pay R30 per month for lighting, you will now only pay R20.
Old fridges use a lot of electricity. So although you might save on the initial cost of the fridge, you are in fact paying more over a five-year period through increased electricity costs.
If you are heating water with a geyser, remember to put a time switch on or to switch it off during the day so that it only heats when you need the water. As much as 50% of your energy bill is from an electric geyser. You can save a lot of money here. Simple things like placing your heater upright and not perpendicular can also save you money as upright geysers heat more efficiently. You can also buy a geyser blanket to insulate the geyser so that it does not lose heat.
Remember to switch off all appliances when not in use
6.3 Use the right energy source for the right activity
Gas is better for space heating and cooking than electricity. It gives an immediate heat and you do not lose money while heating appliances. Also, electricity generation in power plants is very inefficient and you get losses of energy the whole way down the line. Electricity is good for fridges, TVs and computers and lighting.
Consider developing technologies that use renewable energies. These include wind, solar and biogas. Wind energy is especially useful along coastlines. Solar energy is good in most of South Africa and rural areas have already benefited greatly from the establishment of solar home systems. Biogas (the use of biological material to make energy) has great potential in South Africa, particularly in rural and farming areas.
But it is not only energy that can be saved; we can also save other resources like water in the ways described below.
6.4 Composting toilets
South Africa is one of 25 countries in a water crisis. Waterborne sanitation is hugely costly in terms of water use, money and pollution, which is largely unnecessary, as most waste from toilets is water anyway. The installation of flush toilets and the necessary reticulation from the individual household to the sewerage treatment plant can cost between R3500 to R5000 per household plus R100 million upwards for a sewerage treatment plant if none exists in the areas. By contrast, composting toilets are a dry, non-flush, zero discharge system.
Composting toilets are based on a simple system: air is brought into the waste chamber, thereby preventing the smelly bacteria from growing – it is bacteria that cause the methane smell of the commonly used pit latrines. Compost toilets require little maintenance and can be easily designed by a householder if the principles are understood. The only maintenance required is to clean the compost out every few years. This technology is particularly useful in rural areas where water supply is limited. It can and has been adapted to urban living and these toilets are very popular in Sweden.
6.5 Biogas digesters
Another excellent form of sanitation that would appeal to both urban and rural dwellers is a system based on a biogas digester. Essentially a biogas digester is a septic tank, a closed sanitation system existing in a particular area and not linked to a complicated sanitation system requiring treatments works. As many as 200 homes can be attached to a biogas digester and indeed in some parts of the world this form of sanitation is very popular. There are 11 million biogas digesters in China.
The sewage waste gets fed into the biogas digester where it gets broken down and enables methane gas to collect. Methane gas is a very useful source of energy for heating and cooking. It can be collected and used to heat water, or homes, or to be used directly for cooking. This means that the home will save money on energy. But the benefit to local government is even better. There is no need to install bulk infrastructure nor build wastewater treatments plants. An additional benefit of the biogas digester is that the effluent water can be used for irrigation of fruit trees or other trees or above ground vegetables. Everybody wins and the water resources are protected and enhanced.
6.6 Grey waste water system
Grey waste water is the water that comes from basins and baths as opposed to black water, which comes from toilets. Grey water can be used again to flush toilets, or it can be filtered to irrigate gardens. There are many ways of building grey waste water systems. One way is to have a pipe from your basin lead back into the cistern of the toilet. Another is to create a filtration system such as single gravel, stone and sand filter.
6.7 Rainwater harvesting
Allowing rainwater to soak into the soil is very important to help replenish groundwater levels. Harvesting rainwater for household use saves on the amount of potable water you use on tasks such as gardening, cleaning or flushing toilets.
A good place to harvest water from is the roof and all you need is one gutter down pipe leading into a closed plastic tank. A mesh over the top of the down pipe keeps leaves out. Silt will still enter the rain tank and to make sure that it does not become a problem, the tank should have its tap placed at least 50mm from the bottom. The tank itself will be raised off the ground about 300mm so that a bucket can be placed to collect water. Plastic rainwater tanks can be installed for about R1000.
A local community can also manufacture tin systems quite simply. If tin is used, however, the water MUST NOT be used for drinking.
6.8 Landscaping
Plants create a more hospitable climate around houses or buildings so well planned gardens are an excellent tool in sustainable living. Planting deciduous (trees that lose their leaves in winter) on the west side of a building protects the building form the burning heat in summer but allows the sun to heat the building in winter. Indigenous plants are the best to use for water conservation, as they require very little water compared to alien ones. They also require less modification of the soil and are hardier and more drought resistant.
Mulching (strewing woodchips, grass and plant cuttings, etc. on top of the soil) should be done on all the bare soil and around plants. Mulch allows more water to percolate into the soil and decrease rate of evaporation considerably. It also helps to build up the fertility in the soil, and help with increasing the topsoil layers.
Swales (trenches along contours) can be created to ensure that any run-off water (storm water) filtrates into the ground. By building a small dam you can collect the water and use it later.
6.9 Waste recycling
A lot of what we throw away actually has value. Aluminium cans are made of a valuable non-renewable resource that has high costs to the environment in terms of its mining and manufacture. If we set up waste recycling schemes we can achieve the following:
Community waste recycling schemes are wonderful opportunities for people to get involved in helping their community and also improving the local environment.
- Reduced need for rubbish dump sites and landfill space that is expensive to establish and run.
- Create a few jobs where people sort and recycle waste.
- Allow for the re-use and recycling of natural resources like tin, aluminium, paper, glass and plastics.
Economic Policies and Tools Balance of Payments
Economic Policies and Tools
Balance of Payments
The balance of payments of a country is a systematic record of all economic transactions between the residents of the reporting country and the residents of foreign countries during a given period of time. It is an important index, which reflects the true economic position of a country, whether the country is a creditor country or a debtor country, and whether its currency is rising or falling in its external value. There are various types of monetary transactions that take place between two countries:- The export and import of a goods and services
- The international lending and borrowing
- Servicing of foreign debts and their final repayments.
| Balance of Payments of India | ||||||||
| Current Account | Rupees in Crores | |||||||
| Credits | Debits | Net | ||||||
| I. | Merchandise | |||||||
|
||||||||
|
||||||||
| II. | Non-monetary Gold Movements | |||||||
| III. | Invisibles | |||||||
|
||||||||
|
||||||||
|
||||||||
|
||||||||
|
||||||||
|
||||||||
|
||||||||
|
||||||||
|
||||||||
| Total Capital Account (I+II+III) | ||||||||
The items in the table are self-explanatory. One can see that the current account consists of visible exports and imports. The visible exports and imports are those, which are actually recorded at the ports.
The following table shows the components of the capital account.
| Balance of Payments of India | ||||||
| Current Account | Rupees in Crores | |||||
| Credits | Debits | Net | ||||
| I. | Private | |||||
|
||||||
|
||||||
| II. | Banking | |||||
| III. | Official | |||||
|
||||||
|
||||||
|
||||||
| Total Capital Account (I+II+III) | ||||||
The above items are self-explanatory. The capital account reflects the real monetary position of a country in the international capital market.
Changes in the balance of payments produce deep repercussions on the functioning of the economy. A �surplus� in the balance of payment generally means an inflow of income into the country, more economic activity and more employment for the people. A deficit in the balance of payments, on the contrary, implies and outflow of income abroad, less of economic activity and less of employment at home.
Subscribe to:
Posts (Atom)