Thursday, October 17, 2013

What Is The Balance Of Payments?

What Is The Balance Of Payments?

The balance of payments (BOP) is the method countries use to monitor all international monetary transactions at a specific period of time. Usually, the BOP is calculated every quarter and every calendar year. All trades conducted by both the private and public sectors are accounted for in the BOP in order to determine how much money is going in and out of a country. If a country has received money, this is known as a credit, and if a country has paid or given money, the transaction is counted as a debit. Theoretically, the BOP should be zero, meaning that assets (credits) and liabilities (debits) should balance, but in practice this is rarely the case. Thus, the BOP can tell the observer if a country has a deficit or a surplus and from which part of the economy the discrepancies are stemming.

The Balance of Payments Divided
The BOP is divided into three main categories: the current account, the capital account and the financial account. Within these three categories are sub-divisions, each of which accounts for a different type of international monetary transaction.

The Current Account
The current account is used to mark the inflow and outflow of goods and services into a country. Earnings on investments, both public and private, are also put into the current account.

Within the current account are credits and debits on the trade of merchandise, which includes goods such as raw materials and manufactured goods that are bought, sold or given away (possibly in the form of aid). Services refer to receipts from tourism, transportation (like the levy that must be paid in Egypt when a ship passes through the Suez Canal), engineering, business service fees (from lawyers or management consulting, for example) and royalties from patents and copyrights. When combined, goods and services together make up a country's balance of trade (BOT). The BOT is typically the biggest bulk of a country's balance of payments as it makes up total imports and exports. If a country has a balance of trade deficit, it imports more than it exports, and if it has a balance of trade surplus, it exports more than it imports.

Receipts from income-generating assets such as stocks (in the form of dividends) are also recorded in the current account. The last component of the current account is unilateral transfers. These are credits that are mostly worker's remittances, which are salaries sent back into the home country of a national working abroad, as well as foreign aid that is directly received.

The Capital Account
The capital account is where all international capital transfers are recorded. This refers to the acquisition or disposal of non-financial assets (for example, a physical asset such as land) and non-produced assets, which are needed for production but have not been produced, like a mine used for the extraction of diamonds.

The capital account is broken down into the monetary flows branching from debt forgiveness, the transfer of goods, and financial assets by migrants leaving or entering a country, the transfer of ownership on fixed assets (assets such as equipment used in the production process to generate income), the transfer of funds received to the sale or acquisition of fixed assets, gift and inheritance taxes, death levies and, finally, uninsured damage to fixed assets.

The Financial Account
In the financial account, international monetary flows related to investment in business, real estate, bonds and stocks are documented. Also included are government-owned assets such as foreign reserves, gold, special drawing rights (SDRs) held with the International Monetary Fund (IMF), private assets held abroad and direct foreign investment. Assets owned by foreigners, private and official, are also recorded in the financial account.

The Balancing Act
The current account should be balanced against the combined-capital and financial accounts; however, as mentioned above, this rarely happens. We should also note that, with fluctuating exchange rates, the change in the value of money can add to BOP discrepancies. When there is a deficit in the current account, which is a balance of trade deficit, the difference can be borrowed or funded by the capital account.

If a country has a fixed asset abroad, this borrowed amount is marked as a capital account outflow. However, the sale of that fixed asset would be considered a current account inflow (earnings from investments). The current account deficit would thus be funded. When a country has a current account deficit that is financed by the capital account, the country is actually foregoing capital assets for more goods and services. If a country is borrowing money to fund its current account deficit, this would appear as an inflow of foreign capital in the BOP.

Liberalizing the Accounts
The rise of global financial transactions and trade in the late-20th century spurred BOP and macroeconomic liberalization in many developing nations. With the advent of the emerging market economic boom - in which capital flows into these markets tripled from USD$50 million to $150 million from the late 1980s until the Asian crisis - developing countries were urged to lift restrictions on capital and financial-account transactions in order to take advantage of these capital inflows. Many of these countries had restrictive macroeconomic policies, by which regulations prevented foreign ownership of financial and non-financial assets. The regulations also limited the transfer of funds abroad.

With capital and financial account liberalization, capital markets began to grow, not only allowing a more transparent and sophisticated market for investors, but also giving rise to foreign direct investment (FDI). For example, investments in the form of a new power station would bring a country greater exposure to new technologies and efficiency, eventually increasing the nation's overall GDP by allowing for greater volumes of production. Liberalization can also facilitate less risk by allowing greater diversification in various markets.

Does High GDP Mean Economic Prosperity?


Does High GDP Mean Economic Prosperity?

May 30 2013| Filed Under » , ,
Economists traditionally use Gross Domestic Product (GDP) to measure economic progress. If GDP is rising, the economy is good and the nation is moving forward. If GDP is falling, the economy is in trouble and the nation is losing ground. From a strictly numerical perspective, GDP provides an easy-to-follow indicator of economic health. From the perspective of a citizen living with the day-to-day realities of life, GDP can be rather misleading.

This is why the Genuine Progress Indicator (GPI) was created in 1995 by a socially responsible think tank called Redefining Progress. It was developed as an alternative to the traditional GDP measure of a nation's economic and social health. Read on to find out what GDP fails to reveal about a country's economic prosperity and how the genuine progress indicator works to make up this gap.

GPI Variables
Although GPI and GDP calculations are based on the same personal consumption data, GPI provides adjustment factors - variables designed to apply monetary values to non-monetary aspects of the economy. The variables fall into the following general categories:
  • Personal Consumption - As mentioned, this is the exact same data used to calculate GDP.
  • Income Distribution - GPI is adjusted upward when a greater percentage of the nation's income goes to the poor because an income increase provides a tangible benefit to the poor. GPI is adjusted downward when the majority of a nation's increased income goes to the rich.
  • Housework, Volunteering, Higher Education - GPI factors in the value of the labor that goes into housework and volunteering. It also factors in the benefit of an increasingly educated populace.
  • Service of Consumer Durables and Infrastructure - Money spent on durable goods is treated as a cost, while the value the purchases provide is treated as a benefit. Long-lasting goods that provide benefits without having to be frequently repurchased are viewed positively. Goods that wear out quickly and drain consumers' wallets when they must be replaced are viewed negatively. GDP, on the other hand, views all expenditures as good news. Infrastructure spending by the government is treated in a similar manner - if spending provides a long-lasting benefit, GPI views it as a positive; if spending drains the government's coffers, GPI views it as a negative. Again, GDP views all spending as positive.
  • Crime - Rising crime costs money in legal fees, medical bills, replacement costs, and other outlays. GDP views this spending as a positive development. GPI views it as a negative.
  • Resource Depletion - When wetlands or forests are destroyed by economic activity, GDP views the events as good news for the economy; GPI views these events as bad news for future generations.
  • Pollution - Pollution is good news for GDP. Industry gets paid once for the economic activity that creates pollution and again when money is spent to mitigate the pollution. GPI views pollution as a negative.
  • Long-Term Environmental Damage - Global warming, nuclear waste storage and other long-term consequences of economic activity are factored into GPI as negatives.
  • Changes in Leisure Time - Prosperity should lead to an increase in leisure time. Most modern workers would disagree with this theory. GPI views an increase in leisure as a positive and a decrease in leisure as a negative.
  • Defensive Expenditures - Defensive expenditures refer to medical insurance, auto insurance, healthcare bills and other expenses that are required to maintain quality of life. GPI views these as a negative. GDP views them positively.
  • Dependence on Foreign Assets - When a nation is forced to borrow from other nations in order to finance consumption, GPI factors in the result as a negative. If the borrowed money is used for investments and benefits the country, it is viewed as a positive.
The Calculations
GPI calculations take all of these variables into consideration, using economic statistics and mathematical formulas to place value on them. That value is then added to or deleted from the GDP figure. For example, expenditures on consumer durables are a negative adjustment. Data from the National Income and Products Accounts are used to estimate the cost of consumer durables and the figure is subtracted from GDP.

The amount of money that foreigners invest in the United States is subtracted from the amount Americans invest overseas. A five-year rolling average is used to determine whether the U.S. is becoming a lender or a borrower. If our economy is healthy enough that we are a net lender, the resulting number is added to GDP. If we are borrowing to sustain our economy, the resulting number is subtracted.

GPI Is Not Yet Mainstream
While GPI factors in many of the variables that have direct impact on peoples' quality of life, capitalist economies tend to focus strictly on making money. Because of this, GPI has not yet been widely adopted in such economies, although its proponents note that it has been reviewed by the scientific community and recognized for its validity. GPI-type measures are in use in Canada and in some of Europe's small and more progressive nations. Over time, other nations might slowly adopt the concept as environmental concerns move into the public's consciousness.


What The National Debt Means To You


What The National Debt Means To You

The national debt level has been a significant subject of U.S. domestic policy controversy. Given the amount of fiscal stimulus that has been pumped into the U.S. economy over the past couple of years, it is easy to understand why many people are starting to pay close attention to this issue. Unfortunately, the manner in which the debt level is conveyed to the general public is usually very obscure. Couple this problem with the fact that many people do not understand how the national debt level affects their daily life, and you have a center piece for discussion.

National Debt vs. Budget Deficits
Before addressing how the national debt affects a people and a nation, it is first important to understand what the difference is between the federal government's annual budget deficit, and the country's national debt. Simply explained, the federal government generates a budget deficit whenever it spends more money than it brings in through income generating activities such as taxes. In order to operate in this manner, the Treasury Department has to issue treasury bills, treasury notes and treasury bonds to compensate for the difference. By issuing these types of securities, the federal government can acquire the cash that it needs to provide governmental services. The national debt is simply the net accumulation of the federal government's annual budget deficits.


A Brief History of U.S. Debt
Debt has been a part of this country's operations since its economic founding. However, the level of national debt spiked up significantly during President Ronald Reagan's tenure, and subsequent presidents have continued this upward trend. Only briefly during the heydays of the economic markets in the late 1990s has the U.S. seen debt levels trend down in a material manner.

From a public policy standpoint, the issuance of debt is typically accepted by the public, so long as the proceeds are used to stimulate the growth of the economy in a manner that will lead to the country's long-term prosperity. However, when debt is raised simply to fund public consumption, such as proceeds used for Medicare, Social Security and Medicaid, the use of debt loses a significant amount of support. When debt is used to fund economic expansion, current and future generations stand to reap the rewards. However, debt used to fuel consumption only presents advantages to the current generation.

Evaluating National Debt
Because debt plays such an integral part of economic progress, it must be measured appropriately to convey the long-term impacts it presents. Unfortunately, evaluating the country's national debt in relation to the country's gross domestic product (GDP) is not the best approach. Here are three reasons why debt should not be assessed in this manner.


  1. GDP is too complex to make a relative comparison of an acceptable national debt level.
In theory, GDP represents the total market value of all final goods and services produced in a country in a given year. Based on this definition, one has to calculate the total amount of spending that takes place in the economy in order to estimate the country's GDP. One approach is the use of the Expenditure Method, which defines GDP as the sum of all personal consumption for durable goods, nondurable goods and services; plus gross private investment, which includes fixed investments and inventories; plus government consumption and gross investment, which includes public-sector expenditures for services such as education and transportation, less transfer payments for services such as social security; plus net exports, which are simply the country's exports minus its imports. Given this broad definition, one should realize that the components that make up GDP are hard to conceptualize in a manner that facilitates a meaningful evaluation of the appropriate national debt level. As a result, a debt-to-GDP ratio may not fully indicate the magnitude of national debt exposure.

Therefore, an approach that is easier to interpret is simply to compare the interest expense paid on the national debt outstanding in relation to the expenditures that are made for specific governmental services such as education, defense and transportation. When debt is compared in this manner, it becomes plausible for citizens to determine the relative extent of the burden placed by debt on the national budget.

  1. GDP is very difficult to accurately measure.
While the national debt can be precisely measured by the Treasury Department, economists have different views on how GDP should actually be measured. The first issue with measuring GDP is that it ignores household production for services such as house cleaning and food preparation. As a country develops and becomes more modern, people tend to outsource traditional household tasks to third parties. Given this change in lifestyle, comparing the GDP of a country today to its historical GDP is significantly flawed, because the way people live today naturally increases GDP through the outsourcing of personal services.

Moreover, GDP is typically used as a metric by economists to compare national debt levels among countries. However, this process is also flawed because people in developed countries tend to outsource more of their domestic services than people in non-developed countries. As a result, any type of historical or cross-border comparison of debt in relation to GDP is completely misleading.

The second problem with GDP as a measurement tool is that it ignores the negative side affects of various business externalities. For example, when companies pollute the environment, violate labor laws or place employees in an unsafe working environment, nothing is subtracted from GDP to account for these activities. However, the capital, labor and legal work associated with fixing these types of problems are captured in the calculation of GDP.

The third problem with using GDP as a measurement tool is that GDP is greatly impacted by technological advances. Technology not only increases GDP, but also improves the quality of life for all people. Unfortunately, technological advances do not take place in a uniform manner each year. As a result, technology may skew GDP upward during certain years, which in turn may make the relative national debt level look acceptable, when in fact it is not. Most ratios must be compared based on their change through time, but GDP fluctuations result in errors of calculation.


  1. The National Debt is not paid back with GDP.
The national debt has to be paid back with tax revenue, not GDP, although there is a correlation between the two. Using an approach that focuses on national debt on a per capita basis gives a much better sense of where the country's debt level stands. For example, if people are told that debt per capita is approaching $40,000, it is highly likely that they will grasp the magnitude of the issue. However, if they are told that the national debt level is approaching 70% of GDP, the magnitude of the problem will not be properly conveyed.

Comparing the national debt level to GDP is akin to a person comparing the amount of their personal debt in relation to the value of the goods or services that they produce for their employer in a given year. Clearly, this is not the way one would establish their own personal budget, nor is it the way that the federal government should evaluate its fiscal operations.


How the National Debt Affects Everyone
Given that the national debt has recently grown faster than the size of the American population, it is fair to wonder how this growing debt affects average individuals. While it may not be obvious, national debt levels directly affect people in at least five direct ways.

First, as the national debt per capita increases, the likelihood of the government defaulting on its debt service obligation increases, and therefore the Treasury Department will have to raise the yield on newly issued treasury securities in order to attract new investors. This reduces the amount of tax revenue available to spend on other governmental services, because more tax revenue will have to be paid out as interest on the national debt. Over time, this shift in expenditures will cause people to experience a lower standard of living, as borrowing for economic enhancement projects becomes more difficult.

Second, as the rate offered on treasury securities increases, corporations operating in America will be viewed as riskier, also necessitating an increase in the yield on newly issued bonds. This in turn will require corporations to raise the price of their products and services in order to meet the increased cost of their debt service obligation. Over time, this will cause people to pay more for goods and services, resulting in inflation.

Third, as the yield offered on treasury securities increases, the cost of borrowing money to purchase a home will also increase, because the cost of money in the mortgage lending market is directly tied to the short-term interest rates set by the Federal Reserve, and the yield offered on treasury securities issued by the Treasury Department. Given this established interrelationship, an increase in interest rates will push home prices down, because prospective home buyers will no longer qualify for as large of a mortgage loan, since they will have to pay more of their money to cover the interest expense on the loan that they receive. The result will be more downward pressure on the value of homes, which in turn will reduce the net worth of all home owners.

Fourth, since the yield on U.S. Treasury securities is currently considered a risk-free rate of return and as the yield on these securities increases, risky investments such as corporate debt and equity investments will lose appeal. This phenomenon is a direct result of the fact that it will be more difficult for corporations to generate enough pre-tax income to offer a high enough risk premium on their bonds and stock dividends to justify investing in their company. This dilemma is known as the crowding out effect, and tends to encourage the growth in the size of the government, and the simultaneous reduction in the size of the private sector.

Fifth, and perhaps most importantly, as the risk of a country defaulting on its debt service obligation increases, the country loses its social, economic and political power. This in turn makes the national debt level a national security issue.


The Bottom Line
The national debt level is one of the most important public policy issues. When debt is used appropriately, it can be used to foster the long-term growth and prosperity of a country. However, the national debt must be evaluated in an appropriate manner, such as comparing the amount of interest expense paid to other governmental expenditures or by comparing debt levels on a per capita basis.

The Importance Of Inflation And GDP


The Importance Of Inflation And GDP

Investors are likely to hear the terms inflation and gross domestic product (GDP) just about every day. They are often made to feel that these metrics must be studied as a surgeon would study a patient's chart prior to operating. Chances are that we have some concept of what they mean and how they interact, but what do we do when the best economic minds in the world can't agree on basic distinctions between how much the U.S. economy should grow, or how much inflation is too much for the financial markets to handle? Individual investors need to find a level of understanding that assists their decision-making without inundating them in piles of data. Find out what inflation and GDP mean for the market, the economy and your portfolio.Terminology
Before we begin our journey into the macroeconomic village, let's review the terminology we'll be using.

InflationInflation can mean either an increase in the money supply or an increase in price levels. Generally, when we hear about inflation, we are hearing about a rise in prices compared to some benchmark. If the money supply has been increased, this will usually manifest itself in higher price levels - it is simply a matter of time. For the sake of this discussion, we will consider inflation as measured by the core Consumer Price Index (CPI), which is the standard measurement of inflation used in the U.S. financial markets. Core CPI excludes food and energy from its formulas because these goods show more price volatility than the remainder of the CPI. (To read more on inflation, see All About Inflation, Curbing The Effects Of Inflation and The Forgotten Problem Of Inflation.)

GDPGross domestic product in the United States represents the total aggregate output of the U.S. economy. It is important to keep in mind that the GDP figures as reported to investors are already adjusted for inflation. In other words, if the gross GDP was calculated to be 6% higher than the previous year, but inflation measured 2% over the same period, GDP growth would be reported as 4%, or the net growth over the period. (To learn more about GDP, read Macroeconomic Analysis, Economic Indicators To Know and What is GDP and why is it so important?)

Watch: Inflation
The Slippery Slope
The relationship between inflation and economic output (GDP) plays out like a very delicate dance. For stock market investors, annual growth in the GDP is vital. If overall economic output is declining or merely holding steady, most companies will not be able to increase their profits, which is the primary driver of stock performance. However, too much GDP growth is also dangerous, as it will most likely come with an increase in inflation, which erodes stock market gains by making our money (and future corporate profits) less valuable. Most economists today agree that 2.5-3.5% GDP growth per year is the most that our economy can safely maintain without causing negative side effects. But where do these numbers come from? In order to answer that question, we need to bring a new variable, unemployment rate, into play. (For related reading, see Surveying The Employment Report.)Studies have shown that over the past 20 years, annual GDP growth over 2.5% has caused a 0.5% drop in unemployment for every percentage point over 2.5%. It sounds like the perfect way to kill two birds with one stone - increase overall growth while lowering the unemployment rate, right? Unfortunately, however, this positive relationship starts to break down when employment gets very low, or near full employment. Extremely low unemployment rates have proved to be more costly than valuable, because an economy operating at near full employment will cause two important things to happen:

  1. Aggregate demand for goods and services will increase faster than supply, causing prices to rise.
  2. Companies will have to raise wages as a result of the tight labor market. This increase usually is passed on to consumers in the form of higher prices as the company looks to maximize profits. (To read more, see Cost-Push Versus Demand-Pull Inflation.)
Over time, the growth in GDP causes inflation, and inflation begets hyperinflation. Once this process is in place, it can quickly become a self-reinforcing feedback loop. This is because in a world where inflation is increasing, people will spend more money because they know that it will be less valuable in the future. This causes further increases in GDP in the short term, bringing about further price increases. Also, the effects of inflation are not linear; 10% inflation is much more than twice as harmful as 5% inflation. These are lessons that most advanced economies have learned through experience; in the U.S., you only need to go back about 30 years to find a prolonged period of high inflation, which was only remedied by going through a painful period of high unemployment and lost production as potential capacity sat idle.

"Say When"So how much inflation is "too much"? Asking this question uncovers another big debate, one argued not only in the U.S,. but around the world by central bankers and economists alike. There are those who insist that advanced economies should aim to have 0% inflation, or in other words, stable prices. The general consensus, however, is that a little inflation is actually a good thing.

The biggest reason behind this argument in favor of inflation is the case of wages. In a healthy economy, sometimes market forces will require that companies reduce real wages, or wages after inflation. In a theoretical world, a 2% wage increase during a year with 4% inflation has the same net effect to the worker as a 2% wage reduction in periods of zero inflation. But out in the real world, nominal (actual dollar) wage cuts rarely occur because workers tend to refuse to accept wage cuts at any time. This is the primary reason that most economists today (including those in charge of U.S. monetary policy) agree that a small amount of inflation, about 1-2% a year, is more beneficial than detrimental to the economy.


Watch: Monetary Inflation
The Federal Reserve and Monetary Policy
The U.S. essentially has two weapons in its arsenal to help guide the economy toward a path of stable growth without excessive inflation; monetary policy and fiscal policy. Fiscal policy comes from the government in the form of taxation and federal budgeting policies. While fiscal policy can be very effective in specific cases to spur growth in the economy, most market watchers look to monetary policy to do most of the heavy lifting in keeping the economy in a stable growth pattern. In the United States, the Federal Reserve Board's Open Market Committee (FOMC) is charged with implementing monetary policy, which is defined as any action to limit or increase the amount of money that is circulating in the economy. Whittled down, that means the Federal Reserve (the Fed) can make money easier or harder to come by, thereby encouraging spending to spur the economy and constricting access to capital when growth rates are reaching what are deemed unsustainable levels.Before he retired, Alan Greenspan was often (half seriously) referred to as being the most powerful person on the planet. Where did this impression come from? Most likely it was because Mr. Greenspan's position (now Ben Bernanke's) as Chairman of the Federal Reserve provided him with special, albeit un-sexy, powers - chiefly the ability to set the Federal Funds Rate. The "Fed Funds" rate is the rock-bottom rate at which money can change hands between financial institutions in the United States. While it takes time to work the effects of a change in the Fed Funds rate (or discount rate) throughout the economy, it has proved very effective in making adjustments to the overall money supply when needed. (To continue reading about the Fed, see Formulating Monetary Policy, The Federal Reserve and A Farewell To Alan Greenspan.)

Asking the small group of men and women of the FOMC, who sit around a table a few times a year, to alter the course of the world's largest economy is a tall order. It's like trying to steer a ship the size of Texas across the Pacific - it can be done, but the rudder on this ship must be small so as to cause the least disruption to the water around it. Only by applying small opposing pressures or releasing a little pressure when needed can the Fed calmly guide the economy along the safest and least costly path to stable growth. The three areas of the economy that the Fed watches most diligently are GDP, unemployment and inflation. Most of the data they have to work with is old data, so an understanding of trends is very important. At its best, the Fed is hoping to always be ahead of the curve, anticipating what is around the corner tomorrow so it can be maneuvered around today.
The Devil Is in the Details
There is as much debate over how to calculate GDP and inflation as there is about what to do with them when they're published. Analysts and economists alike will often start picking apart the GDP figure or discounting the inflation figure by some amount, especially when it suits their position on the markets at that time. Once we take into account hedonic adjustments for "quality improvements", reweighting and seasonality adjustments, there isn't much left that hasn't been factored, smoothed, or weighted in one way or another. Still, there is a methodology being used, and as long as no fundamental changes to it are made, we can look at rates of change in the CPI (as measured by inflation) and know that we are comparing from a consistent base.Implications for InvestorsKeeping a close eye on inflation is most important for fixed-income investors, as future income streams must be discounted by inflation to determine how much value today' money will have in the future. For stock investors, inflation, whether real or anticipated, is what motivates us to take on the increased risk of investing in the stock market, in the hope of generating the highest real rates of return. Real returns (all of our stock market discussions should be pared down to this ultimate metric) are the returns on investment that are left standing after commissions, taxes, inflation and all other frictional costs are taken into account. As long as inflation is moderate, the stock market provides the best chances for this compared to fixed income and cash.There are times when it is most helpful to simply take the inflation and GDP numbers at face value and move on; after all, there are many things that demand our attention as investors. However, it is valuable to re-expose ourselves to the underlying theories behind the numbers from time to time so that we can put our potential for investment returns into the proper perspective.

Theories of Economic Development

Theories of Economic Development


        Classical Liberal
a. Development is understood as economic growth and capital-formation. The key to economic growth was capital formation.
b. This led to an emphasis on large-scale infrastructure projects and on foreign aid loans.
c. In the "stages" version of this approach, undeveloped countries were thought of largely as "primitive" or "early" versions of Western countires. Lesser Developed Countries needed to follow the pattern of development set by the west. For example, Alexander Gerschenkron and W. W. Rostow.
Social Theories of Development
d. Emphasizes the importance of "human capital" in development. The key to economic growth was education, health, fertility, etc.
e. Shifted concerns from the overall rate of economic growth to considerations of poverty, inequality, urbanization and other social ills.
f. In the "small is beautiful" version of this approach, some economists even questioned the desirability of economic growth. For example, E. F. Schumacher.
Structural Theories
g. Emphasized the conditions unique to Third World countries. The key to economic growth was recognizing that the experience of Europe could be duplicated in the context of former colonies.
h. Shifted concerns to "import substitution," high tariffs and government protectionism. A Marxist version of this set of theories also developed based on Lenin’s analysis of colonialism.
i. In the "dependency" version of this approach, some economists feared that the Third World would regress into a source of raw materials for developed nations and that the world economy would be divided into a "core" and a "periphery." For example, Raul Prebisch.
Neo-classical Theories
j. Emphasizes the negative role often played in development. The key to economic growth is free markets.
k. Shifted concerns from the role of government—often considerable in structural theories—to private investment and market efficiency.
l. This set of theories is currently the most widely practiced. M. Friedman is a major theorist.

Wednesday, October 16, 2013

Basics of Macroeconomics


Graph Background

The circular flow diagram (also called the circular flow model) is perhaps the simplest diagram/model of economics to understand. In essence, the circular flow diagram displays the relationship of resources and money between firms and households. Every adult and even most children can understand its basic structure from personal experience. Firms employ workers, who spend their income on goods produced by the firms. This money (income spent by workers which turns into revenue by firms) is then used to compensate the workers and buy raw materials to make the goods. This is the basic structure behind the circular flow diagram (seen below.)

The Graph

Explanation
In the model, firms and households interact with one another in both the product market (or goods market) and the factors of production market (or factors market). The product market, as mentioned in the name, is where all products made by businesses/firms are exchanged. The factors of production market is where inputs such as land, labor, capital, and other resources are exchanged. Households earn money by selling their “resources” (most often labor) to businesses in the factor market. In return, households receive income. The price of the resources the businesses purchase (labor from households) are the “costs.” From the resources provided by households, businesses produce goods, which are then sold in the product market. Households use their incomes to purchase these goods in the product market. In return for the goods, businesses bring in revenue. While this may seem like a lot of information, it is actually quite logical. Even though the graph itself is extremely simple to most people, it is important to have it completely memorized. Know the names of each market and the actions that occur in each. For high school and college students, the circular flow diagram is a common theme on many tests. It should result in easy points for those of you that have it memorized.

Interest Rates and Money Multiplier

Effect on Interest Rates

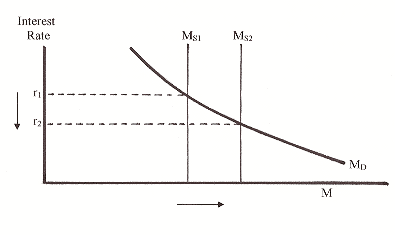
As seen in the money market graph of Chapter 8, the money supply has a direct effect on nominal interest rates in an economy. When the money supply increases, the supply curve shifts to the right and the nominal interest rate decreases. When it decreases, the supply curve shifts left and nominal interest rates increase. Thus, for easy money actions, the increases in the money supply cause interest rates to decrease. With lower nominal interest rates, loans become less costly. Businesses then use these lower interest rates to invest and expand, causing economic growth. For tight money actions, the money supply decreases causing interest rates to increase. Higher nominal interest rates cause loans to become more expensive, consequently causing businesses to expand less. This creates a slowdown in the economy. The effects can be seen on the graphs below.


Money Multiplier
When money enters the money supply, it can have an ever greater effect on the quantity of money than its own value. To estimate and evaluate the effect of an expansion in the money supply, economists use the money multiplier. The money multiplier is the total maximum expansion of the money supply by a single value of money. It exists on the assumption that banks loan out all of the money available as excess reserves and no money is held outside the bank. (e.g. no money is placed in financial investments or held onto as cash.) In reality, this situation is highly unlikely. To calculate the money multiplier, we use the following equation:
Money Multiplier = 1/(Reserve Requirement)
We can then use the money multiplier to calculate the total maximum quantity expansion of money in the economy by the next equation.
Expansion of Money Supply = Money Multiplier x Excess Reserves
*It is important to note the special exception of this equation for new money. (Recall that new money is created when the FED buys bonds on the open market.) The equation remains the same but the quantity of new money must be added to the total expansion of the money supply as follows:
Expansion of MS = (Money Multiplier x Excess Reserves) + New Money
This occurs because the new money is not considered a part of the bank’s reserves. In order to be a reserve, the money must have been received from a customer’s depos

ECON 110 The Money Market - Answers St. Charles Community College Econ 110 Principles of Macroeconomics Answers to Class Discussion Problem

ECON 110 The Money Market - Answers

St. Charles Community College
Econ 110 Principles of Macroeconomics
Answers to Class Discussion Problem

Illustrate the following situations using supply and demand curves for money:
a.    The Fed temporarily reduces the discount rate during a national crisis.

Answer:  By temporarily reducing the discount rate, the Fed makes it easier for banks to borrow money to cover their reserves.  This will increase the money supply and move the money supply curve to the right.  Since we don’t know anything about the “national crisis” we can’t say how the money demand curve demand might move.

Note:  This is one of the actions taken by the Fed on 9/11/01 when the airplanes flew into the World Trade Center.  The Bank of New York had its operations center in the World Trade Center, and the Fed came to its rescue. 

MSupMDnc.gif
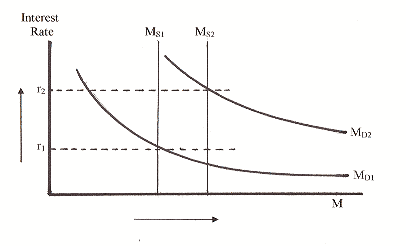
b.    The Fed acts to hold interest rates constant during a period of inflation.

Answer:  During periods of inflation, when prices are rising and goods and services cost more, consumers and firms generally elect to hold higher money balances to cover the higher costs of transactions  This means that the demand for money increases, and the money demand curve shifts to the right.  If the Fed elects to hold interest rates constant as the problem states, the Fed will take action to increase the money supply as required.  This means that the money supply curve will shift to the right until the interest rate is at its original level.
MSupMDup.gif
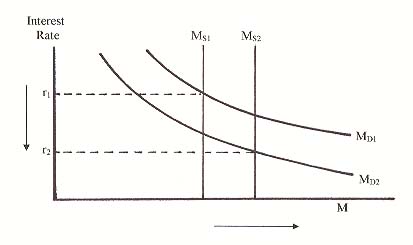
c.    The Fed decreases the reserve ratio during a period of negative GDP growth.

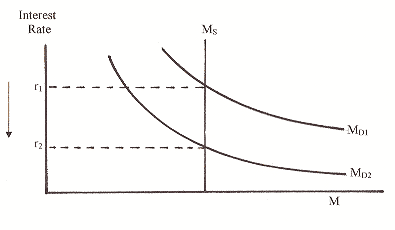
Answer:   In general terms, when the economy is not as healthy as it had been previously, consumers and firms become more cost conscious and tend to rein in their spending due to uncertainty.  This means that the demand for money balances will decrease, and the money demand curve will shift to the left.

If the Fed elects to decrease the reserve ratio, commercial banks are free to lend a higher percentage of their loanable reserves which will expand the money supply.  The money supply curve then shifts to the right.

MSupMDdown.jpg
d.    The Fed buys bonds in the open market during a period of slow economic growth.

Answer:  This is the most common technique used by the Fed to spur the economy during periods of slow economic growth.  When the Fed buys bonds, it puts more money into circulations through the banking system and the money multiplier.  The money supply curve will shift to the right.
MSupMDup.gif

The money demand curve movement can get complicated.  If firms and consumers perceive the slow economic growth as an increase in economic growth, just at a slower rate, the demand for money will increase and the money demand curve will shift to the right as shown below.

However, if firms and consumers perceive the slow economic growth as a mild recession, they may become pessimistic and reduce their demand for money balances.  In that case the money demand curve could shift to the left.

MSupMDdown.jpg
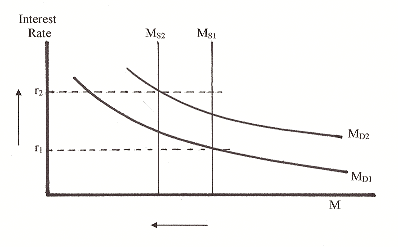
e.    The Fed sells bonds in the open market during a period of rapidly increasing government spending.

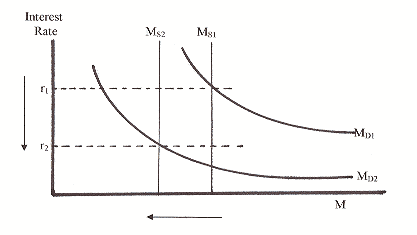
Answer:  When the Fed sells bonds, money is taken out of circulation and the money supply decreases.  Periods of rapidly increasing government spending means that the economy will grow, possibly introducing some amount of inflation.  With prices increasing, households and firms will need to hold cash balances for transactions and the demand for money will increase.   The money demand curve will shift to the right.
MSdownMDup.gif
f.    The Fed sells bonds in the open market during a recession.

Answer:  Again, firms and consumers tend to be hesitant in their spending during uncertain times.  Money demand tends to fall, causing the money demand curve to shift tot the left.  When the Fed sells bonds money is taken out of circulation, and the money supply curve shifts to the left.  This action by the Fed can compound the recessionary problem in the economy, and that’s exactly what happened in this country and in Europe during the great depression of the 1930’s.

The affect on interest rates in this case is uncertain.  It is entirely possible that the two activities could cancel each other in such a manner that interest rates will be affected.

MSdownMDdown.gif
g.    The Fed buys bonds in the open market during a period of high consumer optimism.

Answer: When the Fed buys bonds, money is put into circulation.  The money supply increases, and the money supply curve shifts to the right.  When consumers are optimistic, they spend.  At such times those consumers need more money for transactions, and the money demand curve shifts to the right also.
MSdownMDdown.gif
h.    A large number of consumers begin using debit cards and ATM machines.

Answer:  When technology is introduced into the banking system to the convenience of consumers, the demand for money decreases.  The money demand curve shifts to the left. Think of it this way. You can go to the mall with no cash.  If you see goods or services that you wish to purchase you can go to the nearest ATM machine or reach for your debit card in your wallet or purse. The problem does not say that there is any action on the part of the Fed, so we’ll assume that the Fed takes no action.
MSncMDdown.gif
i.    The Fed sells securities in the open market during a period of high inflation.

Answer:  This situation could very similar to question “e” except that we now have inflation for certain.  During periods of inflation, firms and consumers increase their demand for money because prices are higher.  The money demand curve shifts to the right.  When the Fed sells bonds, it takes money out of circulation, and the money supply curve shifts to the left.
MSdownMDup.gif
j.    Commercial banks raise their loan requirements during a downturn in the economy.

Answer:  Commercial banks commonly protect themselves during bad times by scrutinizing the loan applicants very carefully.  They want to protect themselves against bad loans.  They raise their loan requirements for households and for firms.  Fewer loans mean less money in circulation which means that the money supply curve shifts to the left.  On the demand side, firms and consumers tend to be more conservative in their spending during recessions, so the money demand curve shifts to the left also.
MSdownMDdown.gif

bg_sideBox2_close

Balance of Trade (BOT):

BOT and BOP

Balance of Trade (BOT):
  • Balance of trade is the net exports (NX) of a country.
  • Net exports are the difference between a country's merchandise exports (X) minus its imports (M).
  • BOT includes import and export of physical and tangible goods.
  • Three situations are possible:
    1)
  • NX = X-M = 200 - 100 (billion dollars) = 100 billion dollars.
  • This is called a trade surplus.
  • So if X > M, we have a trade surplus.
  • 2)
  • NX = X-M = 200 - 400 (billion dollars) = -200 billion dollars.
  • This is called a trade deficit.
  • So if X < M, we have a trade deficit.
  • 3)
  • NX = X-M = 200 - 200 (billion dollars) = zero dollars.
  • This is called a trade balance.
  • So if X = M, we have balanced trade.
  • Factors affecting BOT:
  • 1) Exchange rates:
  • 2) Trade barriers:
  • 3) Economic conditions at home:
  • Economic impact of balance of trade:
  • Y= C + I + G + (X-M) or
  • National income = Consumption + Investment + Government expenditure + (Exports - Imports)
  • All of these variables have a positive impact on Y (GDP), except imports, which affects national income negatively.
  • But in GDP accounting, exports and imports are not accounted for independently, but their net effect called net exports (X-M) affects the GDP.
  • If X > M, (X-M) is positive, it's a trade surplus and it positively affects GDP.
  • If X < M, (X-M) is negative, it's a trade deficit and it negatively affects GDP.
  • If X = M, (X-M) is zero, it is balanced trade, and there is no effect on the GDP.
  • Balance of payments (BOP):
  • It is a record of all transactions between one country and the rest of the world.
  • It includes goods, services, financial assets, real assets, transfer payments etc.
  • It is measured per year.
  • It is a flow variable.
  • It is recorded on a double entry bookkeeping methodology.
  • The outflow of payments made to the rest of the world is recorded in the debit account.
  • The inflow of receipts from the rest of the world is recorded in the credit account.
  • The debit side has to match the credit side and hence it is called the Balance of payments (BOP).
  • The major entities in the BOP are:
    1) Balance of trade:
  • This is the trade in physical goods.
  • Exports are credited in the BOP account since it is an inflow of money.
  • Imports are debited in the BOP since it is an outflow of money.
  • If exports >imports = trade surplus
  • If exports< imports = trade deficit
  • If exports = imports then we have balanced trade.
  • The USA has had a trade surplus up to 1975.
  • Ever since then, a trade deficit.
  • 2) Balance on goods and services:
  • The balance of trade is balanced on goods (physical entities).
  • Then there is trade in services which are intangible as insurance, banking, tourism, consulting etc.
  • If the USA gets paid for any of these then it enters as a credit in the BOP.
  • If the USA pays for any of these then it enters as a debit in the BOP.
  •  

    BOT Surplus or deficit good or bad

    BOT: Surplus or deficit: good or bad:
  • This is the balance of trade (BOT) or also called net exports.
  • BOT is the difference between a country's exports (X) and imports (M)
  • If X is greater than M: Net exports are positive and it's a BOT surplus
  • If X=M: Net exports are zero and it's called balanced trade
  • If X is less than M: Net exports are negative and it's a BOT deficit
  • Another term used in this context is "trade balance."
  • It is the difference between a country's output and her consumption or domestic demand (DD.)
  • If output > DD, the gap is exported and it's a trade surplus since X is greater than M
  • If output =DD, X=M and we have balanced trade
  • If output < DD, the gap is imported and it's a trade deficit since X is less than M
  • BOT is influenced by factors affecting a country's exports and imports.
  • Broadly they are:
    1)
  • Value of the local currency, in our example US dollars.
  • If the dollar is strong, M is greater than X and we will have a trade deficit.
  • If the dollar is weak, M is less than X, we will have a trade surplus
    2)
  • Cost of production at home and abroad.
  • If the cost of production at home is greater than the cost of producing the same good abroad, imports will exceed exports.
  • This is generally true for the USA vis-a-vis China.
  • Reversely, if the cost of production at home is less than the cost of producing the same good abroad, exports will exceed imports.
  • This is generally true for China vis-a-vis USA.
  • 3)
  • The stage of the business cycle a country is in.
  • For example generally during the expansionary phase of the business cycle, income is high and so consumption is also possibly high, leading to greater imports and reduced exports.
  • But, the reverse causality is also possible.
  • During the expansionary phase the local currency (the US dollar) may become stronger and appreciate, reducing exports and increasing imports.
  • The final net outcome between the two is difficult to predict.
  • The reverse causation logic can be applied in case of a country in the downswing of a business cycle.
  •  

    BOP Surplus or deficit Good or bad

  • If a country's export (X) is less than its imports (M), there is a trade deficit.
  • That deficit is counterbalanced by earnings from foreign investments and / or foreign loans.
  • Thus overall a country's BOP is always in balance.
  • But individual items can be in surplus or deficit, as discussed below.
  • BOP constitutes the current account (CUA) and the capital account (CAA).
  • The current account is the sum of the country's:
  • a) Balance of trade (X-M)
  • b) Factor earnings which is the difference between a country’s earnings from foreign investment and her payments to foreign investors.
  • c) Cash transfer amongst countries which includes present (current) transactions only, not future income and payment streams
  • CAA is the net change in foreign assets.
  • It is the loans and investments done in foreign countries and the payments from foreign countries.
  • Like the CUA, it includes present (current) transactions only, not future income and payment streams
  • BOP= CUA-CAA (+ or -) balancing item.
  • The balancing items are statistical / accounting errors which are allowed because of the complexity of the items and the volume of revenues in the CUA and the CAA.
  • By standard double entry accounting methods, CUA-CAA =0, but it is not always exact.
  • So some accounting leeway is allowed in terms of the balancing item.
  • In the CUA we have exports (accounted in credit) and imports (accounted in debit) double entry accounting system.
  • Net outcome:
  • M>X: trade deficit
  • M=X: balanced trade
  • M<:X trade surplus
  • Factor earnings go in credit, while factor payments go in debit entry.
  • Reserve account includes the country’s central bank (The Federal Reserve in the USA) reserves of foreign exchange.
  • The International Monetary Fund (IMF) definition of BOP:
  • BOP=CUA-CAA-FA(= + or -) BI
  • Financial accounts are transactions in capital accounts.
  • Causes of BOP imbalances:
  • The USA has a large deficit which could be because of:
  • a) It could be caused by factors affecting the current account
  • b) High exchange rate or appreciating dollar, resulting in high imports from the rest of the world, and low exports to the rest of the world.
  • c) Government running large deficits
  • d) Safe haven currency.
  • This is true for the USA, where other countries save / invest in US dollar assets and so money flows into the USA.
  • This lowers interest rates and raises consumption.
  • This increases the deficit.
  • The US dollar is the reserve currency for the world.
  • Even today, 65% of global reserves are in US dollars, and 25% in EURO.
  • A BOP crisis is a bad thing and should be avoided.
  • It happens when a country has taken huge loans for consumption which is not self sustaining, meaning they do not give returns.
  • Once the investor countries become concerned about the loanee country being able to pay back its loans, they may start to call back their loans.
  • This is the genesis of a BOP crisis.
  • Once a crisis of confidence atmosphere is created, the country’s foreign exchange value drops, exacerbating the crisis.
  • Cure:
  • Changing the country’s exchange rate which is very difficult (nay impossible) under the floating exchange rate system.
  • The logic is say if the dollar depreciates (on its own) then US exports will increase while her imports will decrease, improving her BOT account.
  • But the flip side of this is that a depreciating dollar may cause concern in financial markets, resulting in outflow of funds, causing the capital account to deteriorate.
  • So it is a balancing act.
  • Business Cycles

    Business Cycles

  • Business cycles are the normal fluctuations of the output of a country.
  • A country's GDP (under normal circumstances) grows over time, but not at a steady rate.
  • These fluctuations of the GDP around its steady trend growth line are called business cycles
  • The upswings and down swings of an economy are called business cycles.
  • Sometimes the pace of economic growth is rapid, called the expansionary phase, and sometimes the economy slows down called the contractionary phase.
  • From the diagram below we can see the phases of a business cycle


  • The steady growth line or trend line is the straight line in the middle.
  • The economy (or any economy) does not grow in that steady fashion.
  • Rather it grows in spurts, gathers momentum and grows even faster.
  • Then the reverse happens, and the economy slows down, and now it gathers momentum in the reverse direction, and slows faster and faster.
  • This is the real way an economy grows over time, not in a steady manner.
  • So the irregular ups and downs of an economy are called business cycles.
  • The phases of a business cycle are:
    1) Expansionary Phase:
  • In the business cycle diagram it is the phase when the economy is moving up the cycle of growth, from a trough towards a peak.
  • During this phase there is growth observed all around the economy.
  • Every economic sector is growing.
  • Producers are producing more because people are buying /demanding more goods and services.
  • To produce more goods and services you need more people, so employment goes up.
  • These newly employed spend their money on food, clothing housing etc.
  • Thus the income in those sectors go up too.
  • As aggregate demand goes up, so do prices and profits.
  • So more investment is done in the economy.
  • Thus a positive momentum or a positive domino effect builds up and the economy grows faster and faster.
  • Income, employment, output all increase.
  • 2) Contractionary Phase:
  • The reverse of an expansionary phase happens here.
  • In the business cycle diagram it is the phase when the economy is moving downfrom a peak towards a trough.
  • During this phase there is contraction in economic activity observed all around the economy.
  • Every economic sector is reducing its output.
  • Producers are producing less because people are buying /demanding fewer goods and services.
  • To produce fewer goods and services you need fewer people, so employment goes down.
  • These newly unemployed spend less money on food, clothing housing etc.
  • Thus the income in those sectors go down too.
  • As aggregate demand goes down, so do prices and profits.
  • So private investment goes down too.
  • Thus a negative downward momentum or a negative domino effect builds up and the economy shrinks or contracts faster and faster.
  • Income, employment, output all tend to decrease.
  • 3) Peak:
  • This is the highest point an economy can reach.
  • It is the end of the expansionary phase.
  • Everything that happens in the expansionary phase, culminates at this point.
  • Beyond this point, the downturn starts.
  • 4) Trough:
  • This is the lowest point an economy can reach.
  • It is the end of the contractionary phase.
  • Everything that happens in the contractionary phase, culminates at this point.
  • Beyond this point, the upturn starts.
  • Length of a business cycle:
  • A business cycle is measured as the time period between two troughs or two peaks.
  • Related Concepts:
    Recession:
  • The technical definition is: It is decrease in real GDP over two consecutive quarters.
  • But if there is a significant contraction in economic activity all around, we generally call it a recession.
  • A trough in general would indicate a recession.
  • Depression:
  • A severe form of recession is a depression.
  • Transaction Costs

    Transaction Costs

    key terms

    Smaller transaction costs in doing business across borders
    • A transaction cost is any cost associated with the exchange of a good from one hand to another. Examples include transportation costs, fees, and time.   
    • A common currency eliminates the transaction costs associated with exchanging currencies in order to buy and sell goods across countries. Smaller transaction costs make it easier and more profitable to buy and sell across countries; increasing trade between the two countries.
    Example 1:
    Let’s say you want to buy a pair of pants. Before the monetary union, you would look and see that pants cost either 100 mark in Germany or 8505 pesetas in Spain. You look up the exchange rate to convert the currency, and find that the exchange rate between the mark and the peseta is 100 mark = 8507 pesetas. With 100 mark you could have bought a pair of pants in Germany, but if you had exchanged those 100 mark for pesetas you could buy the Spanish pants and still have 2 pesetas remaining, so the pants are slightly cheaper in Spain. Assume that you only have mark and no pesetas. You might want to buy the cheaper Spanish pants, but in order to buy them you have to go to your local currency converter, which costs you time and inconvenience (which is worth something to you).  Once you get to the currency exchanger, he/she might actually charge you a small fee for his/her work in exchanging your currency.  At this point is it not worth buying the Spanish pants because of the cost involved in getting the pesetas.
    Now assume you have a common currency and pants are 100 € in Germany and 99 € in Spain. You no longer have to exchange any currency because you, Spain, and Germany are using euros. You can just as easily buy the cheaper Spanish pants.
    Example 2:
    You can also think about it in terms of the seller. If the seller wants to take pants made in Spain and sell them in Germany, he/she must accept mark in Germany then exchange them into pesetas to conduct the business of pant making in Spain. There will be a transaction cost of exchanging his/her earned mark into pesetas. This makes selling in Germany just a little more expensive. If however, there are no currency transaction costs, the cost of selling in Germany becomes less expensive and more Spanish companies will sell in Germany, increasing trade (especially if their product is just a little cheaper – leading to greater competition and better prices for consumers). 

    Automatic Stabilizers

    Automatic Stabilizers

    key terms

    Automatic changes to taxes and government spending due to fluctuations in the economy.
    Example – economic downturn:
      • Tax revenue falls because
        • Unemployed persons pay fewer taxes.
        • Those who experience a cut in pay (or have to work fewer hours) pay fewer taxes and might drop into a lower tax bracket
      • Government spending increases as it pays more in
        • Unemployment insurance.
        • Welfare (such as food stamps or healthcare to the uninsured).
        • Job training of the recently unemployed.
    Example – economic upswing:
      • Tax revenue increases because
        • There are more people earning taxable income.
        • Those who get a raise or work more hours have greater income and thus a greater tax liability. They may even creep into a higher tax bracket.
      • Government spending decreases as it pays less in welfare including
        • Unemployment insurance.
        • Food stamps or healthcare to the uninsured.
        • Job training of the recently unemployed.
    Thus the economic upswing causes taxes to rise and spending to fall.  This has the same effect on budgetary balances, output, and unemployment as discretionary fiscal policy without any legislated changes to the tax rate or spending.

    Appreciation and Depreciation

    Appreciation and Depreciation

    key terms

    : An increase in the exchange rate.
      • The home currency becomes relatively more expensive for foreigners to buy. Appreciation also means that foreign currency becomes relatively cheaper for you to buy.
        • If prices in both countries remain the same, an appreciation will make foreign goods relatively cheaper to you, leading to an increase in imports. It also means that, even if prices remain the same, your goods will be more expensive to foreigners. They will buy less of your goods and exports will fall. As a result, your country's net exports will fall.
        • This change to net exports causes a leftward shift of the aggregate demand curve.
      • Example: The exchange rate for the dollar with the euro on June 12, 2008 was e = 0.645 €/$. If the exchange rate today were e = 0.9 €/$ the dollar has appreciated.
        • Let's say I was interested in importing Belgian chocolates that cost 1 € each.
          • If I took $100 to the exchanger on June 12th I would have gotten 65 € and could have bought 65 chocolates.
          • If I took $100 to the exchanger today I would have gotten 90 € and could have bought 90 chocolates!
    • depreciation: A decrease in the exchange rate.
      • The home currency becomes relatively cheaper for foreigners to buy. Depreciation also means that foreign currency becomes relatively more expensive for you to buy.
        • If prices in both countries remain the same, depreciation will make foreign goods relatively more expensive to you, leading to a fall in imports. It also means that, even if prices remain the same, your goods will be cheaper to foreigners. They will buy more of your goods and exports will rise. As a result, your country's net exports will increase.
        • This change to net exports causes a rightward shift of the aggregate demand curve curve.
      • Example:  The exchange rate for the dollar with the Euro on June 12, 2008 was e = 0.645 €/$If the exchange rate today were e = 0.5 €/$ the dollar has depreciated.
        • Let’s say I was interested in importing Belgian chocolates that cost 1 € each
          • If I took $100 to the exchanger on June 12th I would have gotten 65 € and could have bought 65 chocolates.
          • If I took $100 to the exchanger today I would have gotten 50 € and could have bought 50 chocolates!
        • The price of Belgian chocolates did not change, but because the dollar depreciated they become more expensive to you – so you import less.
    « Back to the top

    Gross Domestic Product

    Gross Domestic Product

    key terms

    Mouse-over a link for a quick definition or click to read more in-depth!
    GDP is the amount of all goods and services produced in a given country within a given period of time.
    GDP measures a country’s total output. Since (almost) all that is produced in an economy is eventually bought and turned into income, GDP also measures the amount of income earned in a country for a given period of time.
    • How is GDP used?
      • GDP measures how big a nation is in economic terms
      • GDP per capita is often used to compare the welfare of different countries. Because GDP is also a measure of income, GDP per capita gives an idea of how wealthy the people are on average for a given country. (note: per capita means that you divide total GDP by the number of people in the country)
      • The speed at which GDP grows determines how fast an economy is growing and how healthy the economy is. Higher growth most often means that the economy is strong. If the growth rate of GDP for a country were negative, that country is producing less this year than it did the previous year and the country is in what is called a recession.
        • The growth rate is calculated as the percentage change in GDP from one time period to the next
    The following graph demonstrates the growth rate of GDP for the U.S. and the EU since 1993:
    GDP Growth Rate - US and EU graph
    • How is GDP measured?
      • The most common way to measure GDP is called the expenditure approach. This approach measures GDP by looking at the amount of new goods and services purchased in a country for a given year. A simple equation is used: Y = C + I + G + NX
      • Let’s take Belgium in 2007 as an example. We find that GDP (Y) for Belgium in 2007 is equal to the total amount of goods and services bought by those living in Belgium in 2007 (consumption = C), plus the total amount of investment items bought by Belgium’s businesses and homeowners in 2007 (I), plus the amount of new goods and services bought by the government of Belgium in 2007 (G). The final piece takes into account the fact that people, businesses, and governments outside of Belgium buy Belgium goods (exports), and that people, businesses, and the government in Belgium buy goods produced in other countries (imports). The difference between these two is captured in net exports (NX). 
        • Note: Because GDP trying to provide a measure of what is produced in a country for a given year, only the purchase of new goods (no used cars here) are included in the expenditure approach.
      • GDP calculated this way is measured in terms of a country’s currency. For example, the GDP of Belgium in 2007 was 302 billion €. GDP measured in terms of a currency is called nominal GDP.
        • If nominal GDP increased from one year to the next you would not know if is rose because Belgium produced more or if it rose because the price level in Belgium rose. Measures of real GDP remove the influence that changing prices have on GDP in order to determine whether or not a country is producing more or less from year to year.