Tuesday, March 4, 2014

INTERNATIONAL FINANCE: The study of the flow of monetary payments and the exchange of currencies among nations undertaken as a necessary complement to the international trading of goods and services. The exchange of currencies takes place through the foreign exchange market, which determines the foreign exchange rate, or exchange rate or one currency for another. The balance of payments documents the flow of currency payments into and out of a given country. A related area of study is international trade, both of which are part of the broader study of international economics.

INTERNATIONAL FINANCE:
The study of the flow of monetary payments and the exchange of currencies among nations undertaken as a necessary complement to the international trading of goods and services. The exchange of currencies takes place through the foreign exchange market, which determines the foreign exchange rate, or exchange rate or one currency for another. The balance of payments documents the flow of currency payments into and out of a given country. A related area of study is international trade, both of which are part of the broader study of international economics.
International finance is concerned with the "paper" or financial side of the global economy. Whereas international trade is the study of the flow of physical goods and services among nations, international finance is the study of the corresponding monetary flow used to pay for the physical trade. Goods and services flow in one direction and monetary payments flow in the other.
The flow of monetary payments associated with international trade is an important part of international finance, but only part. International finance is a comprehensive study of all monetary payments among countries, including capital investment and transfer payments. This is captured by an accounting tabulation termed the balance of payments.
The cornerstone of international finance is the exchange of currencies through what is termed the foreign exchange market. Because each nation has its own domestic currency the flow of monetary payments among nations requires the exchange of domestic currencies used by the nations. The purchase of a Japanese automobile in the United States, for example, requires the exchange of U.S. dollars for Japanese yen.

International Trade

The study of international finance is intertwined with the study of international trade. International trade is the flow of goods and services among nations. Goods and services produced in one country are purchased by citizens of another country.
From the perspective of the domestic sector of a given nation, international trade is also termed foreign trade. Exports are sold by domestic producers to buyers in the foreign sector and imports are purchased by domestic buyers from producers in the foreign sector. The difference between exports and imports is termed net exports.
Net exports, once again from the perspective of the domestic sector of a nation, are also tabulated as the balance of trade. The balance of trade is in surplus if net exports are positive and exports exceed imports. Alternatively, the balance of trade is in deficit if net exports are negative and imports exceed exports.
The guiding principle for international trade is the law of comparative advantage. This law states that every nation has a production activity that incurs a lower opportunity cost than that of another nation, which means that trade between the two nations can be beneficial to both if each specializes in the production of a good with lower relative opportunity cost.
International trade, as such, generates gains to both buyers and sellers in the form of consumer surplus and producer surplus, comparable to any market exchange. The key difference is that buyers and sellers are citizens of different countries. However, because buyers and sellers reside in different countries, which use different domestic currencies, a corresponding exchange of currencies is also required.

The Foreign Exchange Market

Trade among nations necessitates the exchange of one currency for another. Because each nation uses its own domestic currency, the monetary payment flow in exchange for the physical flow of goods and services requires the exchange of currencies.
Once again, from the view of the domestic sector of a given nation, any currency used by any nation in the foreign sector is commonly termed foreign exchange. The trading of domestic currency for foreign exchange then transpires through the foreign exchange market. The price of one currency in terms of another currency is then termed the foreign exchange rate, or alternatively the exchange rate.
Foreign Exchange Market
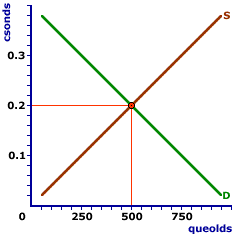
The exhibit to the right illustrates a foreign exchange market for two hypothetical currencies used in two hypothetical countries -- the Republic of Northwest Queoldiola and the United Provinces of Csonda. This foreign exchange market trades queolds (the national currency of Northwest Queoldiola) and csonds (the national currency of Csonda).
This particular foreign exchange market measures queolds on the horizontal "quantity" axis and csonds on the vertical "price" axis. With this particular formulation, the focus of the exchange is on queolds. The price at which queolds are bought at sold is then specified in terms of csonds (or csonds per queold).
For a bit of insight into how the foreign exchange market works, let's a look at the demand curve and supply curve of this market.
  • Demand Curve: The demand curve in this exhibit, labeled D, is the demand for those seeking to purchase queolds. Like other demand curves, this one is negatively sloped. If the price of queolds declines, then buyers are willing to purchase a larger quantity. Queold buyers include non-Queoldiolans seeking to export Queoldiolan goods and invest in Queoldiolan financial or physical capital assets. It also includes financial speculators hoping for a rise in the price of queolds.

  • Supply Curve: The supply curve in this exhibit, labeled S, is the supply for those seeking to sell queolds. Like other supply curves, this one is positively sloped. If the price of queolds rises, then sellers are willing to sell a larger quantity. Sellers of queolds include Queoldiolans importing Csondan goods and investing in Csondan financial or physical capital assets. It also includes financial speculators who are selling queolds after a rise in the price.
The price in the foreign exchange market is termed the foreign exchange rate, or more commonly the exchange rate. This terminology serves to emphasize that the foreign exchange market trades one currency for another.
The foreign exchange market for queolds, in this exhibit, is also the foreign exchange market for csonds. When buyers demand queolds, they also supply csonds. When sellers supply queolds, they also demand csonds. When csonds are exchanged for queolds, then queolds are also exchanged for csonds.
Like any market, the foreign exchange market achieves equilibrium at the intersection of the demand and supply curves. In this exhibit, The equilibrium price is 0.2 csonds per queold and the equilibrium quantity is 500 queolds. The equilibrium price is the currency exchange rate between queolds and csonds. An exchange rate of 0.2 csonds per queold also implies an exchange rate of 5 queolds per csond.
The equilibrium quantity of 500 queolds, taken in conjunction with the equilibrium exchange rate, means that 500 queolds are exchanged for 100 csonds at a rate of 5 queolds to 1 csond.

The Balance of Payments

The balance of payments is the difference between all payments coming into a nation and those going out of the nation. It is the balance of international monetary transactions for a nation. The balance of payments is based in large part on the balance of trade but includes more than just international trade.
The balance of payments is effectively the difference between the funds received by a country and those paid by a country for all international transactions. These international transactions include: (1) the exchange of merchandise (exports and imports), which is the balance on merchandise trade, plus (2) the exchange of services, summarized as thebalance on services, as well as (3) any gifts or transfer payments that do not involve the exchange of goods and services.
The balance of payments is divided into two accounts -- current account(which includes payments for imports, exports, services, and transfers) and capital account (which includes payments for physical and financial assets).
An interesting aspect of the balance of payments is that, in theory, the current account and capital account balance out to zero. In practice, measurement errors prevent an absolute balance.
Measurement problems notwithstanding, the "balancing" of the balance of payments has an important implication. If the current account has a deficit, then the capital account has a matching surplus. Or if the current account has a surplus then the capital account as a matching deficit.

Exchange Rate Policies

Key international finance policies are used by governments around the globe to affect the foreign exchange market and currency exchange rates. The goal of such policies is usually to affect exports and imports. Three particular policy foreign exchange options are flexible exchange ratefixed exchange rate, and managed flexible exchange rate.
  • Flexible Exchange Rate: A flexible exchange rate, also termed floating exchange rate, is an exchange rate determined through the unrestricted interaction of supply and demand in the foreign exchange market.

  • Fixed Exchange Rate: A fixed exchange rate is an exchange rate that is established at a specific level and maintained through government actions (usually through monetary policy actions of a central bank).

  • Managed Flexible Exchange Rate: A managed flexible exchange rate, or managed float, is an exchange rate that is generally allowed to adjust due to the interaction of supply and demand in the foreign exchange market, but with occasional intervention by government.
Most governments of the globe use a managed float policy. Exchange rates are generally allowed to adjust to changing market conditions, but if those changes go too far in one direction or the other, then governments are prone to intervene.

INTERNATIONAL MARKET: A graphical model used to analyze the trade between two nations based on the domestic markets for a particular good in each nation. The international market combines the excess demand (or import demand) from one country with the excess supply (or export supply) from another to illustrate how two nations undertake mutually beneficial trade. The international market model also can be used to analyze the impact of tariffs, import quotas, and export subsidies.

INTERNATIONAL MARKET:
A graphical model used to analyze the trade between two nations based on the domestic markets for a particular good in each nation. The international market combines the excess demand (or import demand) from one country with the excess supply (or export supply) from another to illustrate how two nations undertake mutually beneficial trade. The international market model also can be used to analyze the impact of tariffs, import quotas, and export subsidies.
The international market is a simple model that is used to analyze how and why two nations are inclined to engage in international trade. It combines the domestic market from one nation, presumably with a relatively high domestic price, with the domestic market from another nation, presumably with a relatively low domestic price.
The nation with the higher domestic price contributes the import demand portion of the international market, that is the demand curve. This is the excess demand created as the price falls below its relatively high domestic price. The nation with the lower domestic price contributes the export supply portion of the international market, that is the supply curve. This is the excess supply created as the price rises above its relatively low domestic price.
The international market analysis not only illustrates why and how one nation, with a comparative advantagein the production of a good, trades with another nation, but also the specific quantity traded and the resulting terms of trade, that is the price.

Two Domestic Markets

To develop the international market analysis, consider the hypothetical domestic production of sundials undertaken by two hypothetical countries -- the United Provinces of Csonda and the Republic of Northwest Queoldiola. Northwest Queoldiola has a comparative advantage in the production of sundials.
Two Sundial Markets
Two Sundial Markets
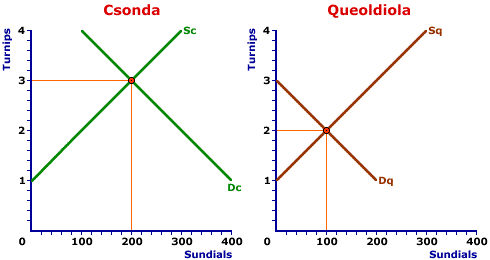
The two-panel exhibit to the right illustrates the two domestic markets for sundials in each of these two countries. The left panel represents the internal domestic market conditions for sundials in the United Provinces of Csonda and the right panel illustrates the domestic market for sundials in the Republic of Northwest Queoldiola. At this stage of the analysis, there is no trade between the two nations.
Let's take a closer look at each domestic market in each country. But first, note that the horizontal quantity axis of each market diagram measures the number of sundials exchanged and the vertical price axis measures the price in terms of another good that is exchanged for the sundials (in this case turnips). Stating price in terms of the foregone production of another good captures the essence of international trade and comparative advantage.
  • Csonda: Working from left to right, the left most panel is the market for sundials in the United Provinces of Csonda. The demand curve for sundials is given by Dc and the supply curve is Sc. Like any market, the intersection of the demand and supply curves is the market equilibrium. This market is in equilibrium at a price of 3 pounds of turnips. While not overly important to the analysis, the quantity exchanged is 200 sundials.

  • Queoldiola: Moving to the right, the right most panel is the market for sundials in the Republic of Northwest Queoldiola. The Queoldiolan demand curve for sundials is Dq and the supply curve is Sq. The intersection of these demand and supply curves is once again market equilibrium, which is achieved at a price of 2 pounds of turnips. The quantity exchanged here is 100 sundials.

Ready to Trade

The primary result from this comparison of the two domestic sundial markets is the relative prices. The price of sundials in Csonda is higher than the price in Northwest Queoldiola (3 versus 2 pounds of turnips per sundial). Of course, these prices could be stated in monetary units, either the domestic Northwest Queoldiolan currency (queolds) or the domestic Csondan currency (csonds), but this complication is not needed here.
Stating price in terms of turnips, however, does emphasize the relative opportunity cost of production in each country. Whereas Csonda foregoes 3 pounds of turnips to produce each sundial, Northwest Queoldiola foregoes only 2 pounds. Hence Northwest Queoldiola has a comparative advantage in sundial production.
And for this reason, it make sense for Csonda to import sundials from Northwest Queoldiola rather than to produce them domestically.
But how much? And at what price?
To answer these questions we need to derived two curves -- one demand and one supply -- that make up what we can call the international market.

Imports: Excess Demand

Excess Demand
Excess Demand

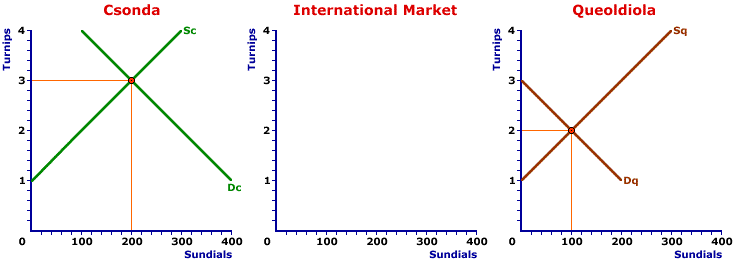
Let's first take a close look at the market for sundials in the United Provinces of Csonda. The exhibit presented in the far left panel of the exhibit reproduces the Csondan sundial market. The demand curve for sundials is given by Dc and the supply curve is Sc. The intersection of the two curves is the market equilibrium that generates the domestic price of 3 pounds of turnips.
Our immediate concern is how the domestic Csondan market reacts if faced with prices higher or lower than the current domestic market price. While higher is a possibility, we are most interested in lower prices.
Suppose, for example, that the price declines from 3 pounds of turnips to 2 pounds of turnips (which coincidentally is the domestic market price in Northwest Queoldiola). This lower price induces the Csondan buyers to increase their quantity demanded and at the same time it encourages the Csondan sellers to decrease their quantity supplied. The result of both actions is a shortage of sundials. A shortage of 200 sundials. Click the [Shortage] button to reveal this value.
Other prices below 3 pounds of turnips also generate shortages. The lower the price, the bigger the shortage. And of course, a 3 pound price has no shortage.
These alternative shortage values at corresponding prices can be plotted in the center panel of this exhibit. The resulting curve is Csonda's excess demand for sundials. It indicates the sundials that Csonda would be willing to import at different prices. Click the [Import Demand] button to reveal this import demand curve.

Exports: Excess Supply

Excess Supply
Excess Supply

Let's now turn to the market for sundials in the Republic of Northwest Queoldiola. The exhibit presented in the far right panel of the exhibit reproduces the Queoldiolan sundial market. The demand curve for sundials is given by Dq and the supply curve is Sq. The intersection of the two curves is once again the market equilibrium that in this case generates the domestic price of 2 pounds of turnips.
Our concern now is how the domestic Queoldiolan market reacts if faced with prices higher or lower than the current domestic market price. While lower is a possibility, we are more interested in higher prices.
Suppose, for example, that the price increases from 2 pounds of turnips to 3 pounds of turnips (which coincidentally is the domestic market price in Csonda). This higher price induces the Queoldiolan buyers to decrease their quantity demanded and at the same time it encourages the Csondan sellers to increase their quantity supplied. The result of both actions is a surplus of sundials. A surplus of 200 sundials. Click the [Surplus] button to highlight this value.
Other prices above 2 pounds of turnips also generate surpluses. The higher the price, the bigger the surplus. And of course, a 2 pound price has no surplus.
These alternative surplus values at corresponding prices can be plotted in the center panel of this exhibit. The resulting curve is Northwest Queoldiola's excess supply of sundials. It indicates the sundials that Northwest Queoldiola would be willing to export at different prices. Click the [Export Supply] button to reveal this export supply curve.

The International Market

The International Market
The derivation of the import demand curve from Csonda and the export supply curve from Northwest Queoldiola sets the stage to identify the quantity of sundials traded between these two nations and the price paid. Click the [International Market] button to reveal both curves.
However, before answering these questions make note of the analytical model being used. This international market analysis is extremely powerful and flexible.
  • More Countries: The import demand curve and the export supply curve can be easily expanded to included other countries. In the same way that a standard market demand curve is derived by adding the demands for several buyers, an import demand curve can be derived by identifying the shortages for a number of countries. The same applies to the export supply curve, as well. The ensuing analysis is essentially unchanged with more than one country on each side of the market.

  • Domestic Shocks: Because this analysis is based on the domestic market conditions for each country, disruptions to those markets are transferred to the international market. If, for example, the domestic demand in an importing country increases, then the import demand curve also increases. Or if the domestic supply in an exporting country decreases, then the export demand curve also decreases.

Equilibrium Trade

Making the Trade
Making the Trade

The import demand curve and export supply curve can be used to answer the questions: "How much?" and "What price?" We're relatively certain that the United Provinces of Csonda will import sundials from the Republic of Northwest Queoldiola based on the analysis of comparative advantage. But we have yet to identify how many sundials will be traded and the price paid for the exchange.This deficiency in the analysis can be rectified with the exhibit to the right.
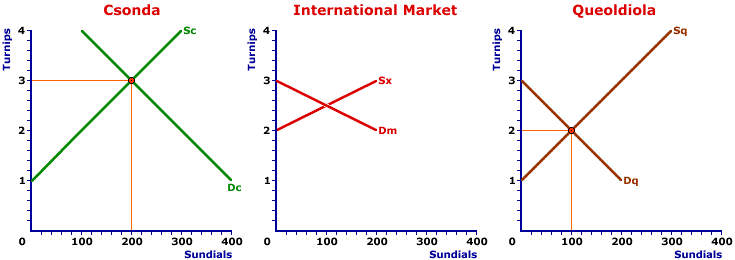
The far left panel is once again the domestic market for sundials in the Csonda. The far right panel is the domestic sundial market in Northwest Queoldiola. The domestic Csondan sundial price is 3 pounds of turnips and the domestic Northwest Queoldiolan price is 2 pounds of turnips.
The center panel then presents the import demand curve, Dm, and the export supply curve, Sx, that make up the international market. The import demand curve is based on the shortage of sundials that arises in Csonda for prices below 3 pounds of turnips. The export supply curve is based on the surplus of sundials that arises in Northwest Queoldiola for prices above 2 pounds of turnips.
Like any market, equilibrium in this international sundial market is achieved by the intersection of the demand and supply curves. This intersection occurs at a price of 2.5 pounds of turnips and a quantity of 100 sundials. Click the [Equilibrium] button to highlight this result. The implication of this equilibrium is that Csonda imports 100 sundials from Northwest Queoldiola, paying a price of 2.5 pounds of turnips each. (Actually this means that Northwest Queoldiola sends 100 sundials to Csonda and in return Csonda sends 250 pounds of turnips to Northwest Queoldiola.)
We can identify the import and export quantities in the respective domestic markets by tracing the 2.5 pound price back to each market. To highlight the 100 sundials imported by Csonda, click the [Import] button. To highlight the 100 sundials exported by Northwest Queoldiola, click the [Export] button. Of course, both values are identical because the international market is in equilibrium balance.

Winners and Losers

An important implication of this analysis is noting who wins and who loses in each of the countries.
  • Csonda: First, consider the United Provinces of Csonda. With foreign trade, the price of sundials declines from 3 pounds of turnips to 2.5 pounds and the quantity of sundials consumed increases from 200 to 275. This is clearly beneficial to the Csonda sundial consumers. They have an increase in the quantity consumed and pay a lower price for each sundial. What more could they want? Unfortunately, the story is not as rosy for the domestic Csondan sundial producers. They had been receiving 3 pounds of turnips for each sundial sold, now they receive only 2.5 pounds. Moreover, they were selling 200 sundials, but with the 100 sundials imported from Northwest Queoldiola, their production declines to 175 sundials. They produce less and receive a lower price, not a recipe for greater profits.

  • Northwest Queoldiola: Now let's turn our attention to the Republic of Northwest Queoldiola. With foreign trade, the price of sundials rises from 2 pounds of turnips to 2.5 pounds and the quantity of sundials produced increases from 100 to 150. This is clearly beneficial to the Northwest Queoldiolan sundial producers. They have an increase in the quantity produced and receive a higher price for each sundial. What more could they want? Unfortunately, the story is not as rosy for the domestic Northwest Queoldiolan sundial consumers. They had been paying 2 pounds of turnips for each sundial bought, now they pay on 2.5 pounds. Moreover, they were buying 100 sundials, but with the 100 sundials exported to Csonda, their consumption declines to 50 sundials. They consume less and pay a higher price, not 

CLASSICAL ECONOMICS: A theory of economics, especially directed toward macroeconomics, based on the unrestricted workings of markets and the pursuit of individual self interests. Classical economics relies on three key assumptions--flexible prices, Say's law, and saving-investment equality--in the analysis of macroeconomics. The primary implications of this theory are that markets automatically achieve equilibrium and in so doing maintain full employment of resources without the need for government intervention. Classical economics emerged from the foundations laid by Adam Smith in his book An Inquiry into the Nature and Causes of the Wealth of Nations, published in 1776. Although it fell out of favor in the 1930s, many classical principles remain important to modern macroeconomic theories, especially aggregate market (AS-AD) analysis, rational expectations theory, and supply-side economics.

CLASSICAL ECONOMICS:
A theory of economics, especially directed toward macroeconomics, based on the unrestricted workings of markets and the pursuit of individual self interests. Classical economics relies on three key assumptions--flexible prices, Say's law, and saving-investment equality--in the analysis of macroeconomics. The primary implications of this theory are that markets automatically achieve equilibrium and in so doing maintain full employment of resources without the need for government intervention. Classical economics emerged from the foundations laid by Adam Smith in his book An Inquiry into the Nature and Causes of the Wealth of Nations, published in 1776. Although it fell out of favor in the 1930s, many classical principles remain important to modern macroeconomic theories, especially aggregate market (AS-AD) analysis, rational expectations theory, and supply-side economics.
Classical economics can be traced to the pioneering work of Adam Smith (often referred to as the father of economics). The specific event launching the modern study of economics and classical economics was the publication by Adam Smith of An Inquiry into the Nature and Causes of the Wealth of Nations in 1776.
Classical economics dominated the study of economics for 150 years after it was introduced. This work not only launched the modern study of economics, it continues to provide the foundation for modernmicroeconomics. Classical economic principles were also adapted to macroeconomic phenomena and provided a guide for macroeconomic policy until the beginning of the Great Depression in 1929. Classical economics fell out of favor in the 1930s largely because it did not adequately explain the occurrence of high rates of unemployment during the Great Depression.
The term "classical economics" was coined in the first half of the 1800s by Karl Marx, who is considered by some as an important contributor to the development of classical economics and by others as a primary critic of this theory. The term gained new life in the early 1900s when John Maynard Keynes developed Keynesian economics as an alternative theory of macroeconomics.
Highlights of classical economics include:
  • One, classical economics is based on three key assumptions--flexible prices, Say's law, and savings-investment equality.

  • Two, the theoretical structure of classical economics is based on a view that the macroeconomy operates in aggregate according to the same basic economic principles that guide markets and other microeconomics phenomena.

  • Three, the economic principles of classical economics indicate that aggregated markets, especially resource markets, automatically achieve equilibrium, meaning full employment',500,400)">full employment of resources is assured.

  • Four, classical economics indicates that full employment is achieved and maintained without the need for government intervention and that government intervention is more likely to cause than to correct macroeconomic problems.

A Little History

Classical economics can trace its roots to Adam Smith in 1776. In The Wealth of Nations Adam Smith presented a comprehensive analysis of economic phenomena based on the notions of free markets and actions guided by individual self interests in a laissez faire environment. This work by Smith was motivated in large part as a critique of the existing merchantilist system.
Under mercantilism the ruling aristocracy directed economic activity with the primary goal of benefiting the ruling aristocracy. The merchantilist view was that the wealth of a nation was based on the wealth of the ruling aristocracy. Smith argued, quite convincingly, that the wealth of a nation was actually based on the productivity of resources, which was best achieved if the producers, consumers, and resource owners were left to their own "selfish" actions.
An efficient allocation of resources, higher living standards, and economic growth were achieved if producers sought higher profit and consumers sought greater satisfaction. Higher profit motivated producers to offer the most desired goods at the lowest expense. Greater satisfaction motivated to seek the most desired goods at the lost expense. The result is the best, more efficient use of available resources.
The classical framework developed by Adam Smith was enhanced, refined, and improved over the ensuring 150 years by a number of scholars. The basic principles were refined and applied to an assortment of topics and issues, including resource markets, international trade, economic development, and industrial activity--to name just a few. Much of this work remains relevant to the modern study of microeconomics, often termed neoclassical economics.
Economists also applied this classical framework to macroeconomic issues, especially unemployment, economic growth, and business-cycle stability. With this application a comprehensive theory of macroeconomics was developed that offered an explanation for macroeconomic phenomena and provided recommendations for government policies.

Three Key Assumptions

The classical study of macroeconomics emerged from a set of axioms and assumptions that were used for all economic analysis, such as wants and needs are unlimited, resources are limited, people are motivated by self interest, and more is preferred to less. However, three particular assumptions proved most important to the study of macroeconomic phenomena--flexible prices, Say's law, and saving-investment equality.
  • Flexible Prices: The first assumption of classical economics is that prices are flexible. With flexible prices, unrestricted by government regulations or market control, markets are able to quickly and efficiently achieve equilibrium. In particular, a market is able to quickly attainment eliminate any shortage and surplus that exists, reaching a balance between the quantity demanded and quantity supplied. This is especially important for resource markets in which equilibrium means that full employment is maintained and unemployment is not a problem.

  • Say's Law: The second assumption of classical economics is that the aggregate production of good and services in the economy generates enough income to exactly purchase all output. Say's law is commonly summarized by the phrase "supply creates its own demand" and is consistent with the modern circular flow model. With Say's law of markets a mismatch between aggregate demand and aggregate supply is a rare and temporary occurrence. The economy is most unlikely to experience an aggregate surplus or shortage of production.

  • Saving-Investment Equality: The last assumption of classical economics is that saving by the household sector exactly matchesinvestment expenditures on capital goods by the business sector. This assumption ensures that Say's law holds because any decrease in consumption demand for output due to saving is replaced by an equal amount of investment demand. The saving-investment equality is assured by applying the notion of flexible prices to interest rates in the financial markets.

A Perfect World?

A world operating according to the principles of classical economics achieves efficiency and full employment. Not only are resources efficiently allocated, but those resources are also fully employed. This "perfect" state of the world results because flexible prices allow buyers and sellers to achieve an equilibrium balance throughout the economy.
  • Efficiency: Efficiency is attained with market equilibrium and the quality between the price that buyers are willing to pay for a good and the price that sellers are willing to accept. At this automatically generated equilibrium, it is not possible to produce more or less of a particular good such that the economy generates a greater level of satisfaction. If buyers find one good that generates greater satisfaction than another, which is reflected in their willingness to pay a higher price, then sellers are enticed to allocate resources to its production.

  • Full Employment: Most important for macroeconomics, full employment is attained because all markets, especially resource and labor markets, achieve equilibrium. With equilibrium, a market has neither a surplus nor a shortage. A surplus in any labor market would mean unemployment. With no surplus, there is no unemployment. The surplus (or shortage) is, of course, eliminated due to flexible prices. If a (temporary) surplus should emerge, then wages--the price of labor--decline until equilibrium balance and full employment is restored.
Perhaps the most important implications of classical economics are that efficiency and full employment are attained without government intervention. Government is not needed to direct resources to the most desired activities--markets do this automatically. Government is not needed to keep resources working--markets do this automatically.
In fact, taking this a step farther, any problems of inefficiency and unemployment that might emerge are attributable to government intervention. From a classical economics perspective, government is the problem, not the solution. Inefficiency and unemployment arise because government prevents markets from achieving equilibrium through regulations, taxes, or other forms of meddling.

A Few of the Founders

As already noted, Adam Smith formed the foundation of classical economics. A host of other economists in the 150 years after Adam Smith contributed greatly to its development. A complete list is not practical at this time, but a short synopsis of the more important players is possible.
  • Jean-Baptiste Say: Say is most noted for the "supply creates its own demand" classical law bearing his name. Say was a French economist who helped to popularize the work of Adam Smith in the early 1800s. Among other contributions, Say emphasized the importance of entrepreneurship as a productive factor and was among the first to observe that value and price depend on both supply (resource cost) and demand (satisfaction).

  • David Ricardo: Considered by many to be the most noted classical economist, Ricardo made a number of contributions to international trade, labor markets, and the distribution of income in the early 1800s that remain fundamental to the modern study of economics. Perhaps most important, Ricardo viewed the economy as a complex system of interrelated components and was a strong advocate of the principles laid out by both Adam Smith and Jean-Baptist Say.

  • Thomas Robert Malthus: A contemporary of David Ricardo and an ordained minister, Malthus developed a theory of population growth which indicated living standards would never rise above a minimal subsistence level. The Malthusian theory of population growth contributed to the economic analysis of wages and was largely responsible for the designation of economics as the "dismal science." Malthus broke from many of his classical colleagues arguing that Say's law might not hold because effective demand would lead to unpurchased production (which was later to become a fundamental part of Keynesian economics).

  • John Stuart Mill: The classical economic mantel was carried forth in the mid-1800s by John Stuart Mill, whose father James Mill was contemporary and colleague of Ricardo, Malthus, and other scholars of the preceding generation. Mills not only authored the primary economic textbook used during this era, he also made important contributions to utility analysis and consumer demand theory.

  • William Stanley Jevons: Jevons made several important contributions to classical economics in a relatively short career. At the top of the list, Jevons helped to develop the mathematical formulation of marginal economic analysis that transformed classical economics into modern neoclassical economics. Jevons also pioneered work onbusiness cycles, especially a "sunspot theory" that connected sunspot activity to agricultural activity and thus to overall economic activity.

  • Alfred Marshall: Marshall, perhaps one of the last of the great classical economists, extended the work of Jevons in the transition of classical to neoclassical economics. In 1890, he authored what was the standard economics textbook for decades, making him the poster boy for classical economics leading up to the Great Depression. Among his many contributions, Marshall developed the modern market diagram (Marshallian cross), the extensive use of graphical analysis used throughout economics, the distinction between short run and long run, and the concept of elasticity.

A Classical Legacy

As already noted, modern microeconomics (especially neoclassical economics) evolved from the classical economics. The basic notions of free markets, equilibrium, and efficiency provide the foundation upon which more complex and realistic analyses are pursued, analyses that take into consideration the market failures of externalities, market control, public goods, and imperfect information.
Classical economics also continues to play an important role in modern macroeconomics. Although popularly discredited by the Great Depression and the theory of Keynesian economics, classical economics persisted and reemerged in the 1980s (when the flaws of Keynesian economics emerged). The core classical notions of unrestricted markets, laissez faire, limited (or no) government intervention, and emphasis on supply rather than demand surfaced in modern macroeconomic theories, including supply-side economics and rational expectations theory.
Perhaps the most important legacy of classical economics is the aggregate market analysis, or AS-AD analysis. Representing the state-of-the-art in modern macroeconomics, AS-AD analysis combines many of features of classical economics and Keynesian economics. In particular, the long-run aggregate supply and the long-run adjustment of the AS-AD model to full employment capture the essential features of classical economics.

A Pinch Of Politics

Any study of macroeconomics, with inherent government policy implications, is inevitably intertwined with politics. Classical economics is no different.
The primary implication of classical economics, that full employment can be achieved without intervention by government, corresponds nicely with aconservative political philosophy. Conservatives stress individual freedoms, reliance on market exchanges, limits on government activity, and support of business activity, all of which match up with classical economics.
This might help to explain why the modern versions of classical economics (supply-side economics and rational expectations theory) surfaced in 1980s along with conservative politics.

KEYNESIAN ECONOMICS: A theory of macroeconomics developed by John Maynard Keynes based on the proposition that aggregate demand is the primary source of business-cycle instability and the most important cause of recessions. Keynesian economics points to discretionary government policies, especially fiscal policy, as the primary means of stabilizing business cycles and tends to be favored by those on the liberal end of the political spectrum. The basic principles of Keynesian economics were developed by Keynes in his book, The General Theory of Employment, Interest and Money, published in 1936. This work launched the modern study of macroeconomics and served as a guide for both macroeconomic theory and macroeconomic policies for four decades. Although it fell out of favor in the 1980s, Keynesian principles remain important to modern macroeconomic theories, especially aggregate market (AS-AD) analysis.

KEYNESIAN ECONOMICS:
A theory of macroeconomics developed by John Maynard Keynes based on the proposition that aggregate demand is the primary source of business-cycle instability and the most important cause of recessions. Keynesian economics points to discretionary government policies, especially fiscal policy, as the primary means of stabilizing business cycles and tends to be favored by those on the liberal end of the political spectrum. The basic principles of Keynesian economics were developed by Keynes in his book, The General Theory of Employment, Interest and Money, published in 1936. This work launched the modern study of macroeconomics and served as a guide for both macroeconomic theory and macroeconomic policies for four decades. Although it fell out of favor in the 1980s, Keynesian principles remain important to modern macroeconomic theories, especially aggregate market (AS-AD) analysis.
Keynesian economics can be traced to the pioneering work of John Maynard Keynes (often referred to as the father of macroeconomics). The specific event launching the modern study of macroeconomics and Keynesian economics was the publication by John Maynard Keynes of The General Theory of Employment, Interest and Money in 1936.
Keynesian economics dominated the study of economics for 40 years after it was introduced. It fell out of favor in the 1980s largely because it did not adequately explain the simultaneous occurrence of high rates ofunemployment and inflation that came to be known as stagflation.
Highlight of Keynesian economics include:
  • One, Keynesian economics offers a theoretical explanation of, and a remedy for, persistent unemployment problems, especially those occurring during the Great Depression.

  • Two, the theoretical structure of Keynesian economics is based on a view that the macroeconomy is a distinct entity operating accord a set of principles distinct from those governing microeconomic phenomena. The macroeconomy economy is more than just a collection of markets.

  • Three, these macroeconomic principles of Keynesian economics indicate that aggregated markets, especially resource markets, do not automatically achieve equilibrium, meaning full employment',500,400)">full employment is not guaranteed.

  • Four, Keynesian economics indicates that the recommended way to achieve full employment is through government intervention, especially fiscal policy.

A Little History

Keynesian economics was developed by John Maynard Keynes in response to the Great Depression of the 1930s. During this decade-long period of economic stagnation and financial turmoil, the unemployment rate in the United States hit a peak of almost 25 percent. During the period from 1931 to 1940, the U.S. unemployment rate NEVER fell below 14 percent. Unemployment was high and persistent, and contrary to the existing macroeconomic theory--classical economics.
Classical economics, as it has come to be known, was effectively launched with the publication of An Inquiry into the Nature and Causes of the Wealth of Nations by Adam Smith in 1776. This work was the first to provide a consolidated theory and analysis of economics and is credited with launching the modern study of economics.
Most important for Keynesian economics, it created the foundation for the classical analysis of macroeconomics. Classical economics rests on three key assumptions:
  • Flexible Prices: The first is that prices are flexible and thus markets are able to quickly and efficiently achieve equilibrium. The attainment of equilibrium eliminates shortages and surpluses, which when applied to resource markets, means that full employment is maintained and unemployment is not a problem.

  • Say's Law: The second assumption is that the aggregate productionof good and services generates enough income to exactly purchase all output. Captured by the phrase "supply creates its own demand," Say's law indicates that business-cycle instability caused by an mismatch between aggregate demand and aggregate supply is a rare and temporary occurrence.

  • Saving-Investment Equality: The last assumption ensures that Say's law holds because any decrease in consumption demand for output due to saving is replaced by an equal amount of investment demand. The saving-investment equality is assured by applying the notion of flexible prices to interest rates in the financial markets.
Classical economics dominated the study of economics for 150 years and continues as the foundation of modern microeconomics. In fact, there was no distinction between macroeconomics and microeconomics during this period. The theory of markets, prices, and equilibrium was applied to all economic phenomena, with little regard for the modern division between microeconomics and macroeconomics.
Over this 150-year period, classical economics was improved, refined, and enhanced. Some economists directed attention to microeconomic topics, others to macroeconomic topics. On the macroeconomic front, classical economics indicated that full employment was the natural state of the economy and could be and would be maintained without government intervention.
This theory not only dominated the study of economics, it was the philosophical guide to government policies in the early 1900s, which undoubtedly played a role in the length and severity of the Great Depression. More to the point, the onset of the Great Depression and the resulting problems that persisted throughout the decade refuted the basic full employment implications of classical economics and paved the way for the emergence of Keynesian economics.
Ironically, after four decades of dominance, flaws in Keynesian economics were revealed by another macroeconomic phenomenon, stagflation. During the 1970s, supply-side shocks to the economy, especially caused by higher oil prices, caused economic instability with the simultaneous occurrence of both higher unemployment rates and higher inflation rates. This contradicted the basic implications of Keynesian economics and led to the formation of modern aggregate market analysis (or AS-AD analysis) as a synthesis and advancement of both classical economics and Keynesian economics.

Keynesian Critique

Keynesian economics not only put forth a new theory of macroeconomics, it also suggested where classical economics went wrong, why it was unable to explain the length and severity of the Great Depression. A discussion of each of the three assumptions of classical economics provides a bit of insight.
  • Flexible Prices: First up is the proposition that wages and prices are inflexible, rather than flexible as assumed in classical economics. Prices might be inflexible, especially in the downward direct, because sellers are reluctant to accept lower prices. Inflexible, or rigid, prices thus prevent markets from eliminating shortages and surpluses. In particular, rigid wages allow a surplus of labor (that is, unemployment) to persist.

  • Say's Law: The question also arises whether supply does in fact create demand, as assumed by Say's law. While, in principle, revenue generated by production ultimately ends up as household income, this does not happen instantaneously. In the meantime, households can only spend the income that they actually have. If they have less income, then they spend less, less is sold, less is produced, and less revenue is generated.

  • Saving-Investment Equality: Another possible problem is the assumed equality between saving and investment. The lack of flexible prices might also prevent equilibrium in financial markets. Moreover, the attainment of equilibrium might actually require negative interest rates. In particular, a disequilibrium in which saving exceeds investment means aggregate demand falls short of aggregate production and is just the sort of thing that would create a sustained depression.
Combining these three critiques indicates why high unemployment rates persisted during the Great Depression. Aggregate demand fell short of production, probably due to a lack of investment expenditures. Resource owners had less income and thus reduced their expenditures. Unemployment increased and the surplus of resources persisted because resource prices did not decline to restore balance.

Keynesian Assumptions

To replace the questionable assumptions of classical economics, Keynesian economics provides three comparable assumptions:
  • Rigid Prices: Contrary to the notion of flexible prices, Keynesian economics presumes that prices are inflexible or rigid, especially in the downward direction. Keynesian economics suggests that inflexible prices result from seller preferences (sellers prefer higher prices to lower prices and are reluctant to accept lower prices), long-term contracts (firms often have long-term contracts stipulating the prices paid for resources), employer preferences (employers often find it easier to lay off a few workers, when they reduce production cost, than to reduce the wages of every worker), and menu costs (firms are reluctant to change prices due to the cost of implementing the change, such as printing new price lists).

  • Effective Demand: Contrary to Say's law, Keynesian economics is based on the notion of effective demand. Effective demand is the principle that consumption expenditures are based on the disposable income actually available to the household sector rather than income that would be available at full employment. This effective demand proposition is embodied in a key Keynesian principle, termed theconsumption function, which is the relation between household consumption expenditures and household income. The consumption function indicates that people use only a fraction of any extra income for consumption.

  • Saving and Investment Determinants: The primary reason for questioning the saving-investment equality presumed in classical economics rests with the determinants of saving and investment. Classical economics relies on the notion that saving and investment are both primarily dependent on the interest rate. A higher interest rate increases saving and decreases investment. A lower interest rate works in the opposite way. Keynesian economics, however, suggests that other factors have greater influence on saving and investment. In particular, household saving is based on household income and the desire to accumulate income for future spending. Business investment is based on the expected profitability of the goods produced with the capital.

The Basic Keynesian Model

Keynesian Cross
Keynesian Cross
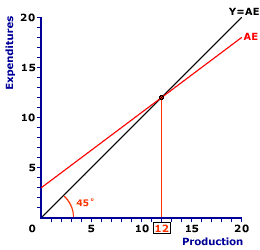
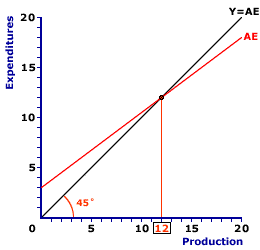
The exhibit to the right is a graphical representation of the basic Keynesian model, commonly termed the Keynesian cross. The "cross" term refers to the intersection between two lines, the red AE line and the black Y=AE line.
Before a closer look at each line, consider the construct of the exhibit. The vertical axis measures expenditures, specifically aggregate expenditures. The horizontal axis measures production, specifically aggregate production or gross domestic product. This exhibit indicates activity in the macroeconomic product markets, or the aggregate product market.
Now consider the two lines.
  • Y=AE: The black Y=AE line, also termed the 45-degree line, indicates all points in the exhibit in which aggregate expenditures is equal to aggregate production, that is, the demand for gross domestic product is equal to the supply of gross domestic product. It is termed a 45-degree line, because it exactly bisects the 90-degree angle of the two axes and thus the angle formed with either axis is exactly 45 degrees. This further means that the slope of the 45-degree line is not only positive, but equal to 1. If the economy is operating on this 45-degree line, then the aggregate product market is in equilibrium.

  • AE: The red AE line, or the aggregate expenditures line, indicates the relation between aggregate expenditures and aggregate production. The aggregate expenditures are the combined expenditures by the four macroeconomic sectors--consumption expenditures by the household sector, investment expenditures by the business sectorgovernment purchases by the government sector, and net exports by the foreign sector. The slope of the AE line is also positive, but less than one. This slope captures the fundamental Keynesian concept of effective demand.
The intersection of the 45-degree line and AE line, which is $12 trillion in this exhibit, is equilibrium. At $12 trillion the aggregate expenditures on production is equal to aggregate production. All four sectors are able to purchase all of the output they want and all output produced is purchased by one of the four sectors. There is neither a surplus nor a shortage of aggregate production.
If the economy is not producing the $12 trillion equilibrium level of aggregate production, then it automatically moves to that level. The key to this movement is business inventories (officially termed private inventories).
  • If, for example, aggregate production is something line $18 trillion, then aggregate expenditures fall short of aggregate production (indicated by the AE line being below the 45-degree line). In this case, all output produced is not sold, business inventories increase, and the business sector is motivated to reduce production, which moves the economy toward the $12 trillion equilibrium.

  • Alternatively, if aggregate production is in the range of $6 trillion, then aggregate expenditures exceed of aggregate production (indicated by the AE line being above the 45-degree line). In this case, the four sectors cannot purchase more output that generated by current production, which they do from accumulated inventories, meaning business inventories decrease and the business sector is motivated to increase production, which also moves the economy toward the $12 trillion equilibrium.
As such, the Keynesian model, like most economic models, has a stable equilibrium. If equilibrium does not exist, the economy moves toward equilibrium. And once there, it remains.

What About Full Employment?

Full Employment
Full Employment

A fundamental proposition of Keynesian economics is that the economy does not necessarily achieve full employment. This is indicated in the Keynesian cross model by one simple observation. Although equilibrium is achieved a $12 trillion, there is no indication how this level of aggregate production relates to full employment. The full employment of resources MIGHT generate $12 trillion of output. Then again, it MIGHT NOT.
If $12 trillion is NOT full employment, two alternatives are possible.
  • Less Than Full Employment: If $12 trillion is less than the amount of aggregate production generated by full employment, then the result is arecessionary gap. A click of the [Less Than] button in the exhibit illustrate how this would look. In this case, the full employment level of aggregate production is $15 trillion. Because production fall short of full-employment production, the result is higher rates of unemployment. A recessionary gap is what plagued the U.S. economy throughout the Great Depression and they tend emerge in the modern economy to a lesser degree every 3 to 5 years.

  • Greater Than Full Employment: If $12 trillion is greater than the amount of aggregate production generated by full employment, then the result is an inflationary gap. A click of the [Greater Than] button in the exhibit illustrate alternative looks. In this case, the full employment level of aggregate production is $9 trillion. Because production exceeds of full-employment production, the result is higher rates of inflation. An inflationary gap is what occurred in the U.S. economy during the 1970s and they tend also emerge every now and then.
The key implication is that the economy ACHIEVES equilibrium at $12 trillion, and thus REMAINS at this level of production... indefinitely. But $12 trillion is NOT necessarily full employment. As such, unemployment or inflation might persist indefinitely... or at least until something happens to shift the AE line.
And shift it does....

Aggregate Expenditures Determinants

Determinants
Determinants

Like other curves that capture economic relations, the AE line is subject to determinants that cause a shift in the line. The actual determinants are many and varied, but they all work through the four aggregate expenditures--consumption expenditures, investment expenditures, government purchases, and net exports. Essentially, anything OTHER than aggregate production or gross domestic product affecting aggregate expenditures causes a shift in the AE line.
The upward and downward shifts of the AE line can be demonstrated by clicking the corresponding [Upward Shift] and [Downward Shift] buttons.
A short, but important, list includes:
  • Interest Rates: Interest rates affect the cost of borrowing the funds used to finance investment expenditures for capital goods and consumption expenditures for durable goods. Higher interest rates decrease aggregate expenditures, causing a downward shift of the AE line, and lower interest increase aggregate expenditures, causing an upward shift of the AE line.

  • Confidence or Expectations: The confidence of expectations of the household and business sectors affects how much they are willing to spend. If they are confident and optimistic about the economy, then they are likely to increase consumption and investment expenditures, which increases aggregate expenditures and causes an upward shift of the AE line. If they are not confident and pessimistic about the economy, then they are likely to decrease consumption and investment expenditures, which decreases aggregate expenditures and causes a downward shift of the AE line.

  • Government Policies and Federal Deficit: The federal deficit is the difference between government expenditures and tax collections. If the federal government spends more than it collects in taxes, then a federal deficit results. Although less common, if spending is less than tax collections, then a federal surplus results. Most important for Keynesian economics, government policies have an impact on the federal deficit (surplus). An increase in government spending or a decrease in taxes, which causes an increase in the federal deficit, also causes an increase in aggregate expenditures and an upward shift of the AE line. A decrease in government spending or an increase in taxes, which causes a federal surplus or a decrease in the federal deficit, also triggers a decrease in aggregate expenditures and a downward shift of the AE line.
These three determinants of aggregate expenditures are most important to Keynesian economics because the reflect the source and solution to business-cycle instability. According to Keynesian economics, interest rates and expectations, which induce changes in consumption and investment expenditures, are prime sources of business-cycle instability, especially causing recessionary gaps and higher rates of unemployment. Government policies, particularly fiscal policy, and changes in the federal deficit are then the prime solution to business-cycle instability and the means of achieving full employment.

The Multiplier

The Multiplier
The Multiplier

Shifts of the AE line trigger what is termed the multiplier process. This process reflects the magnified change in aggregate production or gross domestic product that results from an initial change in one of the aggregate expenditures.
The exhibit to the right demonstrates the multiplier process. The original equilibrium exists at $12 trillion of aggregate production. Now suppose that a reduction in interest rates induces a $1 trillion increase in investment expenditures on capital goods.
  • To display the shift of the aggregate expenditures line, click the [Upward Shift] button. This reveals a new aggregate expenditures line that is $1 trillion higher than the original line.

  • The new equilibrium is found at the intersection of the 45-degree line and the new aggregate expenditures line, which is $16 trillion of aggregate production. The difference between the original equilibrium and the new equilibrium is $4 trillion. This amount is four times the initial change in investment, which is the multiplier process.
This change in aggregate production can be divided into two parts--autonomous and induced.
  • Autonomous: The initial change in investment causes a vertical shift of the aggregate expenditures line that disrupts the existing equilibrium. This is the initial autonomous change in expenditures. Click the [Autonomous] button to highlight this initial autonomous change indicated between point A and point B.

  • Induced: This autonomous change in expenditures then induces further changes in aggregate production and expenditures, especially consumption expenditures. In particular, the household sector is induced by this additional income generated from the additional production to increase consumption expenditures. Click the [Induced] button to highlight this adjustment. This is the movement along the aggregate expenditures line from point B to point C. The movement along the aggregate expenditures line is what restores balance between aggregate expenditures and aggregate production.
The movement along the aggregate expenditures line not only restores equilibrium it also generates the multiplier process. The reason is that each change in aggregate production on the supply side of the economy induces a change in consumption and aggregate expenditures on the demand side. The process of closing one gap between production and expenditures ends up creating another gap.
For example, the initial investment creates a $1 trillion imbalance between production and expenditures. This gap is closed with $1 trillion of production. However, this production induces $750 billion of consumption, which creates a new $750 billion gap. Closing this gap with $750 billion of production induces another $563 billion in consumption, which creates another new gap.
Fortunately the gaps grow smaller until they shrink to virtually nothing. The multiplier process ends when these gaps become infinitesimally small.

Fiscal Policy

Fiscal Policy
Fiscal Policy


The last component of Keynesian economics is the use of fiscal policy to trigger the multiplier process and close any recessionary or inflationary gaps that might have been created due to changes in interest rates, expectations, or some aggregate expenditures determinant.
Fiscal policy is the use of the government spending and taxing to stabilize the business cycle. The goal of fiscal policy is to counteract the problems of unemployment and inflation created by the ups and downs of business-cycle instability.
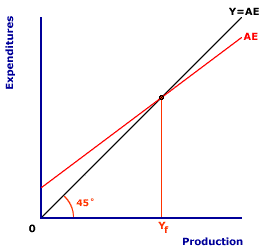
This particular exhibit illustrates the desired situation for the economy. The equilibrium achieved by the intersection of the AE line and the 45-degree line at Yf also happens to be the full-employment level of aggregate production. However, if the AE line is shifted to another position, then full-employment equilibrium is not achieve and the use of fiscal policy is indicated by Keynesian economics.
A recessionary gap emerges if aggregate expenditures decrease, and can be illustrated by a click of the [Recessionary Gap] button. An inflationary gap emerges if aggregate expenditures increase, and can be illustrated by a click of the [Inflationary Gap] button.
The specific course of fiscal policy, either expansionary or contractionary, depends on which type of gap exists and the nature of the business-cycle instability. The goal of fiscal policy is to shift the AE line such that it counters any shifts caused by other expenditures. If a decline in investment, for example, causes a downward shift of the AE line, with the prospects of creating a business-cycle contraction, then expansionary fiscal policy seeks a corrective upward shift. Alternatively, an increase in consumption, which causes an upward shift of the AE line which is likely to create inflation, then contractionary fiscal policy can be used fro a corrective downward shift.

  • Expansionary Fiscal Policy: This is designed to correct the unemployment problems caused by a business-cycle contraction. Expansionary fiscal policy includes increased government purchases, decreased taxes, and/or increased transfer payments. A click of the [Expansionary Policy] button indicates how this type of fiscal policy can be used to close a recessionary gap.

  • Contractionary Fiscal Policy: This is designed to correct the inflation problems caused by a business-cycle expansion. Contractionary fiscal policy includes decreased government purchases, increased taxes, and/or decreased transfer payments. A click of the [Contractionary Policy] button indicates how this type of fiscal policy can be used to close an inflationary gap.

SELF CORRECTION, RECESSIONARY GAP:

SELF CORRECTION, RECESSIONARY GAP:
The automatic process in which the aggregate market eliminates a recessionary gap created by a short-run equilibrium that is less than full employment through decreases in wages (and other resource prices). The self-correction mechanism is triggered by short-run resource market imbalances that are closed by long-run price flexibility. The self-correction process of the aggregate market also acts to close an inflationary gap with higher wages (and other resource prices).
Self correction is seen as shifts of the short-run aggregate supply curvecaused by changes in wages and other resource prices. The self-correction mechanism acts to close a recessionary gap with lower wages and an increase in the short-run aggregate supply curve.
With a recessionary gap, short-run equilibrium real production is less than full-employment real production, meaning resource markets have surpluses. In particular, labor unemployment exceeds the natural rate. Self correction is the process in which these temporary imbalances are eliminated through flexible prices as the aggregate market achieves long-run equilibrium. The key to this process is that changes in wages and other resource prices cause the short-run aggregate supply curve to shift.
Closing A Recessionary Gap
Recessionary Gap

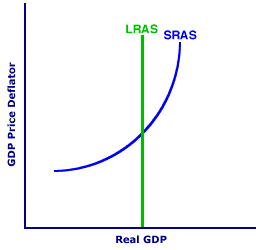
The self-correction closure of a recessionary gap in the aggregate market can be illustrated using the exhibit to the right. The vertical axis measures the price level (GDP price deflator) and the horizontal axis measures real production (real GDP).
This graph presents the two aggregate supply curves--long run and short run--but no aggregate demand curve. The vertical curve labeled LRAS is the long-run aggregate supply curve which marks full-employment real production. The positively-sloped curve labeled SRAS is then the short-run aggregate supply curve. The positioning of the aggregate demand curve and the point of intersection with the short-run aggregate supply curve indicates the recessionary gap.
  • Recessionary Gap: Click the [Recessionary Gap] button to reveal this output gap. With a recessionary gap, short-run equilibrium real production is less than full-employment real production, meaning resource markets have surpluses, and in particular labor is unemployed.

  • Closing the Gap: In the long-run, this recessionary gap is closed with lower wages and an increase in short-run aggregate supply. To illustrate this result, click the [Lower Wages] button. This button-clicking shifts the short-run aggregate supply curve to the right. A new equilibrium is achieved by the intersection of the new SRAS curve and the original AD curve. This intersection also coincides with the LRAS curve.
In the long run, wages and resource prices are flexible and they decline enough to eliminate imbalances in the resource markets. The result of declining wages (and other resource prices) is a reduction in production cost. A decrease in production cost causes an increase in short-run aggregate supply, or a rightward shift of the SRAS curve.
Note that the SRAS curve shifts rightward until it intersects BOTH the LRAS and AD curves at full-employment real production, which is long-run equilibrium. In particular, the new long-run equilibrium is at the full-employment level of real production. The SRAS curve absolutely MUST shift until this long-run equilibrium is reached. If the aggregate market does NOT reach long-run equilibrium, resource market imbalances persist, resource prices and production cost decline further, and the SRAS curve shifts more. However, once long-run equilibrium is reached, resource market imbalances are eliminated, resource prices and production cost do not change, and the SRAS curve does not shift any further.

During recessions declines in investment account for about , test

1. During recessions declines in investment account for about
a.   1/6 of the decline in real GDP.
b.   1/3 of the decline in real GDP.
c.    1/2 of the decline in real GDP.
d.   2/3 of the decline in real GDP.
ANS: D (YOU DON’T NEED TO KNOW THIS QUESTION J)

2. Investment is a
a.   small part of real GDP, so it accounts for a small share of the fluctuation in real GDP.
b.   small part of real GDP, yet it accounts for a large share of the fluctuation in real GDP.
c.    large part of real GDP, so it accounts for a large share of the fluctuation in real GDP.
d.   large part of real GDP, yet it accounts for a small share of the fluctuation in real GDP.
ANS: B (YOU DON’T NEED TO KNOW THIS QUESTION J)
      3.   When the dollar depreciates, U.S.
a.   exports and imports increase.
b.   exports increase, while imports decrease.
c.    exports decrease, while imports increase.
d.   exports and imports decrease.
ANS: B                 
      4.   When the dollar appreciates, U.S.
a.   exports decrease, while imports increase.
b.   exports and imports decrease.
c.    exports and imports increase.
d.   exports increase, while imports decrease.
ANS: A                 
      5.   When the dollar depreciates, each dollar buys
a.   more foreign currency, and so buys more foreign goods.
b.   more foreign currency, and so buys fewer foreign goods.
c.    less foreign currency, and so buys more foreign goods.
d.   less foreign currency, and so buys fewer foreign goods.
ANS: D

6. Suppose a stock market boom makes people feel wealthier. The increase in wealth would cause people to desire
a.   increased consumption, which shifts the aggregate demand curve right.
b.   increased consumption, which shifts the aggregate demand curve left.
c.    decreased consumption, which shifts the aggregate demand curve right.
d.   decreased consumption, which shifts the aggregate demand curve left.
ANS: A
7. The initial impact of an increase in an investment tax credit is to shift
a.   aggregate demand right.
b.   aggregate demand left.
c.    aggregate supply right.
d.   aggregate supply left.
ANS: A
8. Imagine that businesses in general believe that the economy is likely to head into recession and so they reduce capital purchases. Their reaction would initially shift
a.   aggregate demand right.
b.   aggregate demand left.
c.    aggregate supply right.
d.   aggregate supply left.
ANS: B
9. When taxes increase, consumption
a.   decreases as shown by a movement to the left along a given aggregate demand curve.
b.   decreases as shown by shifting aggregate demand to the left.
c.    increases as shown by shifting aggregate supply the left.
d.   None of the above is correct.
ANS: B

10. Other things the same, when the government spends more, the initial effect is that
a.   aggregate demand shifts right.
b.   aggregate demand shifts left.
c.    aggregate supply shifts right.
d.   aggregate supply shifts left.
ANS: A
   11.   If countries that imported goods and services from the United States went into recession, we would expect that U.S. net exports would
a.   rise, making aggregate demand shift right.
b.   rise, making aggregate demand shift left.
c.    fall, making aggregate demand shift right.
d.   fall, making aggregate demand shift left.
ANS: D
   12.   If the dollar appreciates ($ gains value), then U.S. net exports
a.   increase which shifts aggregate demand right.
b.   increase which shifts aggregate demand left.
c.    decrease which shifts aggregate demand right.
d.   decrease which shifts aggregate demand left.
ANS: D

13. The aggregate supply curve is upward sloping rather than vertical in
a.   the short and long run.
b.   neither the short nor the long run.
c.    the long run, but not the short run.
d.   the short run, but not the long run.
ANS: C

14. Which of the following is not a determinant of the long-run level of real GDP?
a.   the price level
b.   the supply of labor
c.    available natural resources
d.   available technology
ANS: A
   15.   Which of the following would shift the long-run aggregate supply curve to the right?
a.   an increase in the actual price level
b.   an increase in the money supply
c.    increased international trade
d.   None of the above is correct.
ANS: C


   16.   Which of the following, other things the same, would make the price level decrease and real GDP increase in the long run?
a.   long-run aggregate supply shifts right
b.   long-run aggregate supply shifts left
c.    aggregate demand shifts right
d.   aggregate demand shifts left
ANS: A

   17.   Which of the following shifts both the short-run and long-run aggregate supply right?
a.   an increase in the actual price level
b.   an increase in the expected price level
c.    an increase in the capital stock
d.   None of the above is correct.
ANS: C

18. Which of the following would cause prices to fall and output to rise in the short run?
a.   Short-run aggregate supply shifts right.
b.   Short-run aggregate supply shifts left.
c.    Aggregate demand shifts right.
d.   Aggregate demand shifts left.
ANS: A

   19.   If something caused resources to become more readily available, then
a.   the price level and real GDP would rise.
b.   the price level and real GDP would fall.
c.    the price level would rise and real GDP would fall.
d.   the price level would fall and real GDP would rise.
ANS: D

20. An economic contraction caused by a shift in aggregate demand causes prices to
a.   rise in the short run, and rise even more in the long run.
b.   rise in the short run, and fall back to their original level in the long run.
c.    fall in the short run, and fall even more in the long run.
d.   fall in the short run, and rise back to their original level in the long run.
ANS: C

Figure 23-1
   21.   Refer to Figure 23-1. A decrease in interest rates would move the economy from C to
a.   B in the short run and the long run.
b.   D in the short run and the long run.
c.    B in the short run and A in the long run.
d.   D in the short run and C in the long run.
ANS: C                 
                               
   23.   Refer to Figure 23-1. If the economy is at A and there is a fall in aggregate demand, in the short run the economy
a.   stays at A.
b.   moves to B.
c.    moves to C.
d.   moves to D.
ANS: D                 
   24.   Refer to Figure 23-1. If the economy starts at A and there is a fall in aggregate demand, the economy moves
a.   back to A in the long run.
b.   to B in the long run.
c.    to C in the long run.
d.   to D in the long run.
ANS: C          

25. Refer to Figure 23-1. In the short run, a favorable shift in aggregate supply would move the economy from
a.   A to B.
b.   B to C.
c.    C to D.
d.   D to A.
ANS: A          

   26.   Suppose the economy is initially in long-run equilibrium and aggregate demand rises. In the long run prices
a.   and output are higher than in the original long-run equilibrium.
b.   and output are lower than in the original long-run equilibrium.
c.    are higher and output is the same as the original long-run equilibrium.
d.   are the same and output is lower than in the original long-run equilibrium.
ANS: C

The Stock Market Boom of 2010
Imagine that in 2010 the economy is in long-run equilibrium. Then stock prices rise more than expected and stay high for some time.
   27.   Refer to Stock Market Boom 2010. Which curve shifts and in which direction?
a.   aggregate demand shifts right
b.   aggregate demand shifts left
c.    aggregate supply shifts right
d.   aggregate supply shifts left.
ANS: A                 
   28.   Refer to Stock Market Boom 2010. In the short run what happens to the price level and real GDP?
a.   both the price level and real GDP rise.
b.   both the price level and real GDP fall.
c.    the price level rises and real GDP falls.
d.   the price level falls and real GDP rises.
ANS: A                 
   29.   Refer to Stock Market Boom 2010. What happens to the expected price level and what impact does this have on wage bargaining?
a.   The expected price level falls. Bargains are struck for higher wages.
b.   The expected price level falls. Bargains are struck for lower wages.
c.    The expected price level rises. Bargains are struck for higher wages.
d.   The expected price level rises. Bargains are struck for lower wages.
ANS: C                 
   30.   Refer to Stock Market Boom 2010. In the long run, the change in price expectations created by the stock market boom shifts
a.   long-run aggregate supply right.
b.   long-run aggregate supply left.
c.    short-run aggregate supply right.
d.   short-run aggregate supply left.
ANS: D                 
   31.   Refer to Stock Market Boom 2010. How is the new long-run equilibrium different from the original one?
a.   the price level and real GDP are higher
b.   the price level and real GDP are lower.
c.    the price level is higher and real GDP is the same.
d.   the price level is the same and real GDP is higher.
ANS: C
32. An increase in the price level and a decrease in real GDP in the short run could be created by
a.   an increase in the money supply.
b.   an increase in government expenditures.
c.    a fall in stock prices.
d.   bad weather in farm states.
ANS: D

Answers
1.                  d
2.                  b
3.                  b
4.                  a
5.                  d
6.                  a
7.                  a
8.                  b
9.                  b
10.              a
11.              d
12.              d
13.              c
14.              a
15.              c
16.              a
17.              c
18.              a
19.              d
20.              c
21.              c
22.              not existing
23.              d
24.              c
25.              a
26.              c
27.              a
28.              a
29.              c
30.              d
31.              c
32.              d