OPPORTUNITY COST, PRODUCTION POSSIBILITIES:
The production possibilities analysis, which is the alternative combinations of two goods that an economy can produce with given resources and technology, can be used to illustrate opportunity cost--the highest valued alternative foregone in the pursuit of an activity.
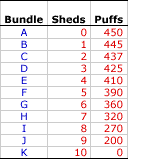
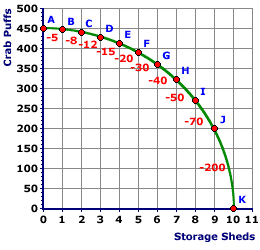
A production possibilities schedule presents alternative combinations of two goods that an economy can produce with existing resources andtechnology. A production possibilities curve illustrates similar information using a convex curve.
A Tradeoff
| Production Possibilities |
|---|
 |
In other words, there is a tradeoff between the production of sheds and puffs. As more sheds are produced, fewer puffs are produced.
The reason for this can be traced to theassumption underlying production possibilities analysis that resources are fixed. Because resources are fixed, producing more of one good necessarily means producing less of the other. That is, to produce more sheds, the economy must forego the production of puffs. Limited resources must be switched from puffs to sheds.
Enter Opportunity Cost
This sounds a lot like opportunity cost. Opportunity cost is the highest valued alternative foregone in the pursuit of an activity. The opportunity cost of producing storage sheds is the foregone production of crab puffs.
Here are a few numbers to illustrate.
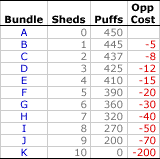
- The opportunity cost of producing the first shed is 5 dozen crab puffs.
- As the economy moves from bundle A to bundle B, the production of sheds increases from 0 to 1 and the production of crab puffs decreases from 450 dozen to 445 dozen.
- In order to produce the first shed, the economy must switch resources from crab puff production to shed production.
- As such, 5 dozen crab puffs are given up to produce the first shed.
Note that these opportunity cost values are negative, which indicates the tradeoff between sheds and crab puffs. But also note that the absolute values (ignoring the negative sign) grow larger as more sheds are produced.
Slope and Cost
| Production Possibilities Curve |
|---|
 |
Increasing Opportunity Cost
The production possibilities schedule indicates that the opportunity cost of shed production increases as more sheds are produced. At the top of the schedule, the opportunity cost of the first shed is 5 dozen crab puffs. At the bottom of the schedule the opportunity cost of the tenth shed is 200 dozen crab puffs.
The reason for this pattern rests with the law of increasing opportunity cost, one of the more important principles studied in economics. The law of increasing opportunity cost states that the opportunity cost of producing a good increases as more of the good is produced.
The law of increasing opportunity cost results due to the third rule of inequality, which in this case means that all resources are not created equal.
- The production of the first shed, moving from bundle A to bundle B, uses resources best suited for shed production and least suited for crab puffs production. As such, very few crab puffs are given up to produce one shed.
- However, as more sheds are produced, resources that are removed from crab puffs production are more suited for crab puffs production and less suited for shed production.
- With production of the tenth shed, going from bundle J to bundle K, the resources switched are those least suited for sheds and best suited for crab puffs. As such, a relatively large number of crab puffs are given up to produce one shed.
- As more sheds are produced, the opportunity cost of production increases.
| Increasing Cost |
|---|
 |

No comments:
Post a Comment