What is Microeconomics?
Microeconomics is the branch of economics which looks at choices made by narrowly defined units, such as individual buyers/consumers, and firms that produce goods.
Two of the most important principles used by economists are the Law of Supply and the Law of Demand:
Law of Supply
The law of supply says that, all other things remaining equal, as the price of a good increases (decreases), the quantity of that good supplied will increase (decrease).
Law of Demand
The law of demand states that, all other things remaining equal, as the price of a good increases (decreases), the quantity of that good demanded will decrease (increase).
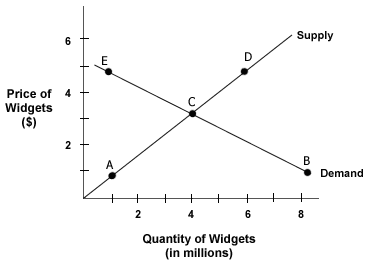
Economists often use graphs as a way to demonstrate what is being discussed. The laws of supply and demand can be represented by a simple graph such as the one below.
In figure 3.1, we can see that at the price of $1, the suppliers are willing to provide one million widgets (Point A), while the quantity demanded will be much higher - eight million (Point B).
At a higher price, such as $5, suppliers will be willing to provide six million widgets (Point D), while the quantity demanded is only one million (Point E).
Finally, at the price of $3, the quantity demanded is equal the quantity supplied (Point C). This price is also referred to as the "market clearing" or equilibrium price because no suppliers are left with the desire to provide goods at that price and no buyers are left wishing to purchase the goods at that price either.
Change in Consumer Preference
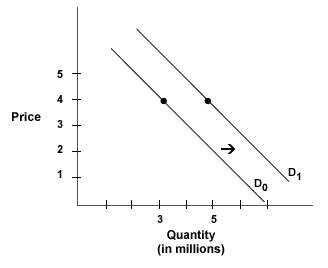
Suppose there was a significant change in consumer preferences. For example, consumers suddenly have an increased desire for corn. This change in taste may be due to a new health study touting the benefits of corn, alternative grains such as wheat may have gotten more expensive, or corn growers may have conducted an effective advertising campaign. Regardless of the reason, the increase in demand results in a greater quantity demanded at particular price levels. This is an example of a demand shift.
In the graph above D0 represents the original demand curve, while D1 shows the new demand curve. Note that at a particular price level, such as $4, the quantity demanded increases from three million to five million.
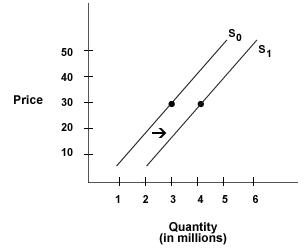
Suppose something happens where the quantity of a good supplied changes at many particular price levels. For example, technological changes might occur whereby computer memory manufacturers would be able to produce a particular type of memory at a lower cost. So for many price levels, the quantity suppliers are willing to provide will increase. This situation could be diagrammed as below:
S0 represents the original supply curve, while S1 represents the new supply curve. At the price of $30 per 256MB chip, the quantity supplied will increase from three million to four million units per month.
Supply and Demand Movements
Changes in quantity demanded strictly as a function of price are referred to as movement along a demand curve. A shift of the entire demand curve is referred to as a change in demand; this could be due to any factor(s) that affects demand, other than price.
Changes in quantity supplied strictly as a function of price are referred to as movement along a supply curve. A shift of the entire supply curve is referred to as a change in supply; this could be due to any factor(s) that affects supply, other than price.
Demand Curve Shifts
Some of the factors that can cause a demand curve to shift include:
Factors that would cause a shift in the supply curve include:
In the short run, market equilibrium is achieved when the quantity demanded is equal to quantity supplied and the market clears. The market is said to be cleared because there is no additional quantity supplied, or quantity demanded, at the market clearing price.
However, that particular market price may not lead to equilibrium in the long run. In the short run, producers do not have time to fully adjust to current market conditions. Some current producers may not be making a profit or covering all their costs at the current market price. Producers in that situation will consider leaving the industry, or at least will not allocate further capital to that industry. If producers are making profits, then we would expect more resources to be allocated to the industry such as the building of additional factories. In the long run, all factors of production can be varied.
Long-run equilibrium is something we expect the market to move towards over time. The process could take years. It actually may never be achieved because demand and supply curves are constantly shifting.
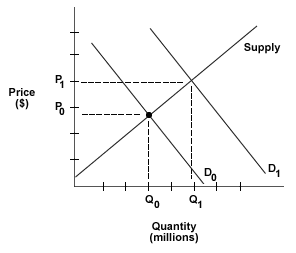
Suppose there is an increase in demand, as shown by the graph below.
D0 is the original demand curve, and D1 is the new demand curve. The market equilibrium price will increase from P0 to P1, at least in the short-run. The quantity will also increase from Q0 to Q1.
Over time, in a market economy, two forces will come into play:
A "shortage" exists when the quantity demanded at the current price is greater than the quantity supplied. In the case of shortage, we would expect the market price to go up. In this case, less motivated buyers do not purchase the good and producers have a strong incentive to supply more at the higher market price. This process will continue until the quantity demanded is equal to the quantity supplied. A "surplus" exists when the quantity supplied is greater than the quantity demanded. In this case, we would expect the market price to go down. The lower market price entices more consumers into buying, but lower profits create an incentive for producers to reduce the quantity supplied.
Invisible Hand Principle
Market prices deliver information to producers on how to allocate capital and other resources. Prices tell producers about consumer needs and wants by showing them how much consumers are willing to pay for a particular good or service. Prices also inform consumers by sending signals about how much of a given product is available.
These market prices act as an "invisible hand" that pushes self-interested individuals toward the correct allocation of resources, benefitting both the individuals and society as a whole. No one person is consciously making these decisions.
The following tutorial, entitled Economics Basics, will prime you for the topics discussed in this chapter.
Microeconomics is the branch of economics which looks at choices made by narrowly defined units, such as individual buyers/consumers, and firms that produce goods.
Two of the most important principles used by economists are the Law of Supply and the Law of Demand:
Law of Supply
The law of supply says that, all other things remaining equal, as the price of a good increases (decreases), the quantity of that good supplied will increase (decrease).
Law of Demand
The law of demand states that, all other things remaining equal, as the price of a good increases (decreases), the quantity of that good demanded will decrease (increase).
Economists often use graphs as a way to demonstrate what is being discussed. The laws of supply and demand can be represented by a simple graph such as the one below.
 |
| Figure 3.1: Law of Supply and Demand |
In figure 3.1, we can see that at the price of $1, the suppliers are willing to provide one million widgets (Point A), while the quantity demanded will be much higher - eight million (Point B).
At a higher price, such as $5, suppliers will be willing to provide six million widgets (Point D), while the quantity demanded is only one million (Point E).
Finally, at the price of $3, the quantity demanded is equal the quantity supplied (Point C). This price is also referred to as the "market clearing" or equilibrium price because no suppliers are left with the desire to provide goods at that price and no buyers are left wishing to purchase the goods at that price either.
| Look Out! Note that supply and demand curves depict a quantity supplied or a quantity demanded at a particular price, all other things remaining equal. |
Change in Consumer Preference
Suppose there was a significant change in consumer preferences. For example, consumers suddenly have an increased desire for corn. This change in taste may be due to a new health study touting the benefits of corn, alternative grains such as wheat may have gotten more expensive, or corn growers may have conducted an effective advertising campaign. Regardless of the reason, the increase in demand results in a greater quantity demanded at particular price levels. This is an example of a demand shift.
 |
| Figure 3.2: Shift in the Demand Curve |
In the graph above D0 represents the original demand curve, while D1 shows the new demand curve. Note that at a particular price level, such as $4, the quantity demanded increases from three million to five million.
Suppose something happens where the quantity of a good supplied changes at many particular price levels. For example, technological changes might occur whereby computer memory manufacturers would be able to produce a particular type of memory at a lower cost. So for many price levels, the quantity suppliers are willing to provide will increase. This situation could be diagrammed as below:
 |
| Figure 3.3: Shift of the Supply Curve |
S0 represents the original supply curve, while S1 represents the new supply curve. At the price of $30 per 256MB chip, the quantity supplied will increase from three million to four million units per month.
Supply and Demand Movements
Changes in quantity demanded strictly as a function of price are referred to as movement along a demand curve. A shift of the entire demand curve is referred to as a change in demand; this could be due to any factor(s) that affects demand, other than price.
Changes in quantity supplied strictly as a function of price are referred to as movement along a supply curve. A shift of the entire supply curve is referred to as a change in supply; this could be due to any factor(s) that affects supply, other than price.
Demand Curve Shifts
Some of the factors that can cause a demand curve to shift include:
- Change in income - If consumer incomes increase, we might reasonably expect that demand for some luxury goods will increase.
- Change in preferences/tastes - If a product becomes more (less) liked, the quantity demanded will increase (decrease).
- Change in prices of goods that are complimentary - If the price of gasoline goes up substantially, the demand curve for large SUV's should shift down.
- Changes in prices of goods that are substitutes - If the price of pork increases (decreases), demand for beef would likely increase (decrease).
- Advertising - An effective advertising campaign could increase the quantity demanded of a particular good. It could also decrease the demand for a competing good.
- Expectations - If consumers expect a good to become more expensive or hard to get in the future, it could alter current demand
- Shifts in market demographics - As segments of the population age or their composition changes, their demands also change. Because segments are not equally distributed – that is, there are not a consistent number of people in every age category – larger segments have a more noticeable impact on demand. The baby boomers are an excellent example of this.
- Distribution of income - For example, if the rich get richer, and the poor get poorer, demand for luxury goods could increase.
Factors that would cause a shift in the supply curve include:
- Cost - An increase in crude oil costs for a plastic manufacturer would shift the supply curve up and to the left. Changes in technology can dramatically decrease costs.
- Government tax policy - Increases in business taxes will cause the supply curve to shift up and to the left. A government subsidy to producers will cause more supply to be available - the supply curve will shift down and to the right.
- Weather/climate - Changes in weather and/or climate will especially influence agricultural product supply.
- Prices of substitute products - If farmers can grow wheat instead of corn, and the price of wheat goes up, then the supply curve for corn will shift up and to the left as more farmers switch from corn to wheat.
- Number of producers - As the number of firms/individuals producing a product increases, we would expect more supply to be available.
In the short run, market equilibrium is achieved when the quantity demanded is equal to quantity supplied and the market clears. The market is said to be cleared because there is no additional quantity supplied, or quantity demanded, at the market clearing price.
However, that particular market price may not lead to equilibrium in the long run. In the short run, producers do not have time to fully adjust to current market conditions. Some current producers may not be making a profit or covering all their costs at the current market price. Producers in that situation will consider leaving the industry, or at least will not allocate further capital to that industry. If producers are making profits, then we would expect more resources to be allocated to the industry such as the building of additional factories. In the long run, all factors of production can be varied.
Long-run equilibrium is something we expect the market to move towards over time. The process could take years. It actually may never be achieved because demand and supply curves are constantly shifting.
Suppose there is an increase in demand, as shown by the graph below.
 |
| Figure 3.4: Effects of a Shift in Demand |
D0 is the original demand curve, and D1 is the new demand curve. The market equilibrium price will increase from P0 to P1, at least in the short-run. The quantity will also increase from Q0 to Q1.
Over time, in a market economy, two forces will come into play:
- Buyers will have an incentive to search for substitutes, thereby decreasing their purchase of the original good; this effect will tend to lower the quantity demanded and the market price
- Suppliers will have an incentive to supply more of the good, and more resources will be allocated towards production of this good; this effect will tend to increase the quantity and lower the market price
A "shortage" exists when the quantity demanded at the current price is greater than the quantity supplied. In the case of shortage, we would expect the market price to go up. In this case, less motivated buyers do not purchase the good and producers have a strong incentive to supply more at the higher market price. This process will continue until the quantity demanded is equal to the quantity supplied. A "surplus" exists when the quantity supplied is greater than the quantity demanded. In this case, we would expect the market price to go down. The lower market price entices more consumers into buying, but lower profits create an incentive for producers to reduce the quantity supplied.
Invisible Hand Principle
Market prices deliver information to producers on how to allocate capital and other resources. Prices tell producers about consumer needs and wants by showing them how much consumers are willing to pay for a particular good or service. Prices also inform consumers by sending signals about how much of a given product is available.
These market prices act as an "invisible hand" that pushes self-interested individuals toward the correct allocation of resources, benefitting both the individuals and society as a whole. No one person is consciously making these decisions.
The following tutorial, entitled Economics Basics, will prime you for the topics discussed in this chapter.

No comments:
Post a Comment